
Scatter Plot by patel.riya
Loading the math board and drawing, please wait…
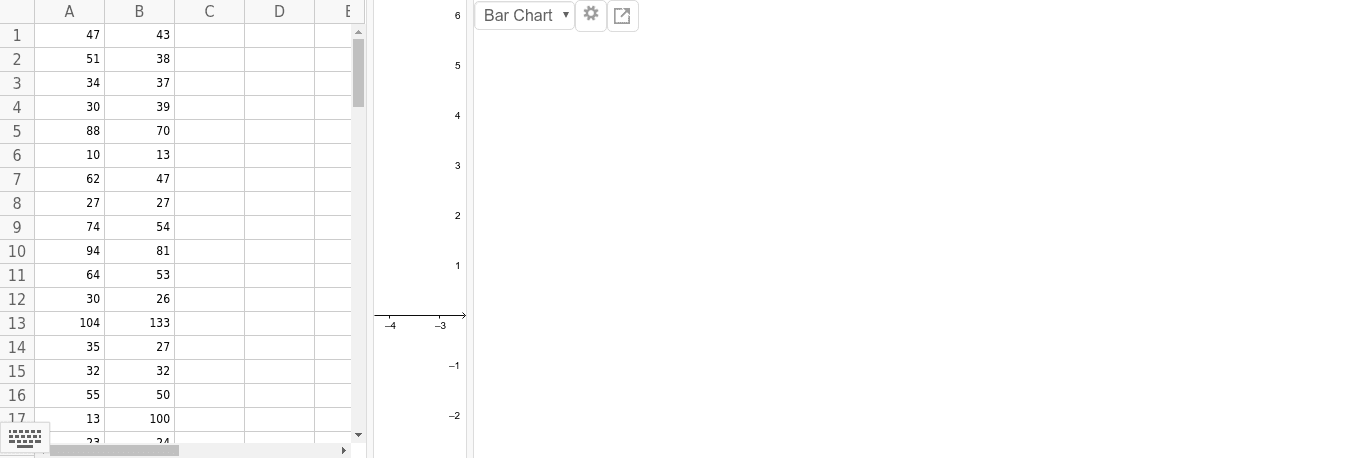
This example demonstrates how to create a scatter plot. It involves key mathematical concepts such as functions, fractal geometry, and logarithms. Using GeoGebra commands like ResidualPlot, a series of points reflecting the relationship between data can be constructed. Suitable for high school and above students or teachers.
GeoGebra Commands & Parameters
ResidualPlot({(47, 43), (51, 38), (34, 37), (30, 39), (88, 70), (10, 13), (62, 47), (27, 27), (74, 54), (94, 81), (64, 53), (30, 26), (104, 133), (35, 27), (32, 32), (55, 50), (13, 100), (23, 24), (20, 65), (47, 39), (40, 37), (14, 10)}, FitPoly[{(47, 43), (51, 38), (34, 37), (30, 39), (88, 70), (10, 13), (62, 47), (27, 27), (74, 54), (94, 81), (64, 53), (30, 26), (104, 133), (35, 27), (32, 32), (55, 50), (13, 100), (23, 24), (20, 65), (47, 39), (40, 37), (14, 10)}, 1]) →