
Scatter Plot by lesgurrola
Loading the math board and drawing, please wait…
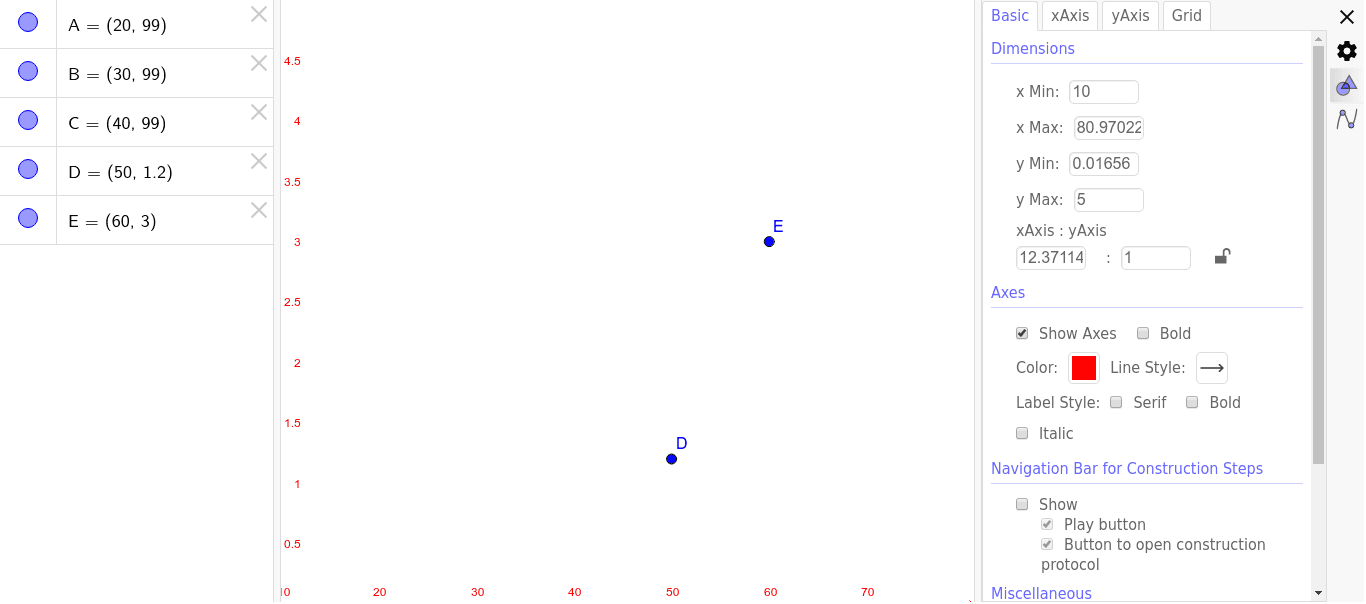
This example demonstrates how to create a scatter plot. Key mathematical concepts include the distribution of data points and basic statistical ideas. Using objects A, B, C, D, and E from the construction summary, one can learn how to draw a scatter plot in GeoGebra. Suitable for middle school and above students or teachers for teaching and learning.
GeoGebra Commands & Parameters
A:(20, 99)B:(30, 99)C:(40, 99)D:(50, 1.2)E:(60, 3)