
Scatter Plot and Line of Best Fit
Loading the math board and drawing, please wait…
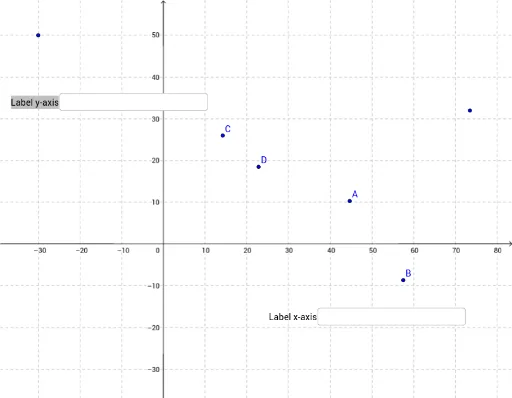
① This example demonstrates how to create a scatter plot from a set of data points in GeoGebra and automatically generate the line of best fit (linear regression line), visually showing the trend and linear relationship among the data. ② Core mathematical concepts include scatter plots, linear regression, least squares method, equation of the fitted line, and intuitive understanding of correlation. ③ Construction highlights: from the construction summary, Textfield is used to create multiple input boxes (InputBox1 to InputBox9) for entering data point coordinates, FitLineY command computes the best-fit line of Y on X, Line command draws the line, objects A, B, C, D, E, F are defined as data points, and text objects text1 to text4 provide labels. The interactive design allows users to modify data dynamically and observe changes in the fitted line. ④ Suitable for middle school statistics and data analysis units, as well as introductory college statistics or data science courses, helping students grasp the geometric meaning and practical application of linear regression.
GeoGebra Commands & Parameters
Textfield(A) → InputBox1Textfield(B) → InputBox2Textfield(C) → InputBox3Textfield(D) → InputBox5Textfield() → InputBox4Textfield() → InputBox6FitLineY({B, C, D}) → LineLine(E, F) → fTextfield() → InputBox7Textfield() → InputBox8Textfield() → InputBox9
AI Drawing Prompt Reference
Create a scatter plot with six data points, each adjustable via input boxes. Automatically generate a best-fit line through three of the points to show the trend. Add a separate reference line connecting two fixed points. Include text labels for the points, the fitted line equation, and explanatory notes. The layout should clearly display the relationship between data points and the fitted line, allowing dynamic updates when data points are changed.
The prompt above was compiled from the original drawing commands and is for reference only.