
Sampling Distribution
Loading the math board and drawing, please wait…
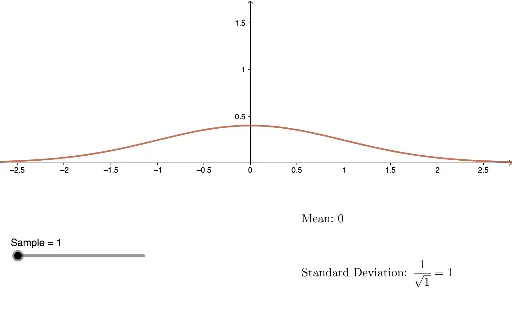
This example illustrates the concept of sampling distribution. It involves core concepts in probability and statistics, observing changes in the sampling distribution by adjusting sample size and mean. It uses GeoGebra commands such as Mean, Std, and Sample, suitable for high school or university probability and statistics courses.
GeoGebra Commands & Parameters
Numeric Mean(0)Numeric Std(1)Numeric Sample(1)Std / sqrt(Sample)f(x) = (1 / ((newstd * sqrt((2 * π)))) * ℯ^((-0.5 * ((x - Mean) / newstd)^(2))))g(x) = (1 / ((Std * sqrt((2 * π)))) * ℯ^((-0.5 * ((x - Mean) / Std)^(2))))
AI Drawing Prompt Reference
Draw a graph illustrating the concept of sampling distribution, featuring two normal distribution curves: one for the population distribution and one for the sampling distribution. Adjust the sample size and mean to observe changes in the sampling distribution. The population distribution has fixed mean and standard deviation, while the sampling distribution's standard deviation changes with sample size and shares the same mean as the population distribution.
The prompt above was compiled from the original drawing commands and is for reference only.