
Sampling Distribution Comparison
Loading the math board and drawing, please wait…
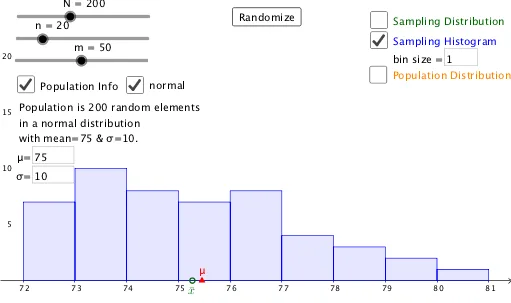
This example demonstrates how to compare population distributions with sampling distributions and parameters with statistics. It involves core mathematical concepts like sampling distributions, normal distribution, means, standard deviations, and statistics. Constructed using GeoGebra commands/objects such as Sequence, If, DotPlot, Normal, Max, Textfield, and Histogram. Suitable for high school and above students learning about sampling distribution theory and its application in statistical inference.
GeoGebra Commands & Parameters
Sequence(Random[0, 100], i, 1, N) → Pop0Sequence(round(RandomNormal[mu, sd]), i, 1, N) → Pop0nIf(an, Pop0n, Pop1) → Pop1aSequence(mean[First[Shuffle[Pop1a], n]], i, 1, m) → l1DotPlot(l1) → l2If(¬g, ceil(Max[x(l2)]), ceil(Max[Pop1a])) → xmaxIf(¬g, floor(Min[x(l2)]), floor(Min[Pop1a])) → xminNormal(50, 50, 15) → aMax(y(l2)) → ymaxSequence(xmin + (i * bins), i, 0, ceil(range / bins)) → l3Textfield(bins) → InputBox1Histogram(l3, l1, false) → bTextfield(f) → InputBox2Textfield(mu) → InputBox3Textfield(sd) → InputBox4DotPlot(Pop1a) → l4If(¬d, Max[10, (ymax * 1.5)], m / 2) → e
AI Drawing Prompt Reference
Create a visualization comparing two distributions: one is a normal distribution with randomly generated data and the other is a discrete distribution. Generate two sets of data, each containing multiple sample points, and plot histograms and dot plots for each set. Overlay a standard normal distribution curve on the normal distribution. Adjust the number of bins for the histograms. Finally, display the histograms and dot plots side by side to compare the distributions.
The prompt above was compiled from the original drawing commands and is for reference only.