
Rotation of a Function Around the x‑Axis (Volume)
Loading the math board and drawing, please wait…
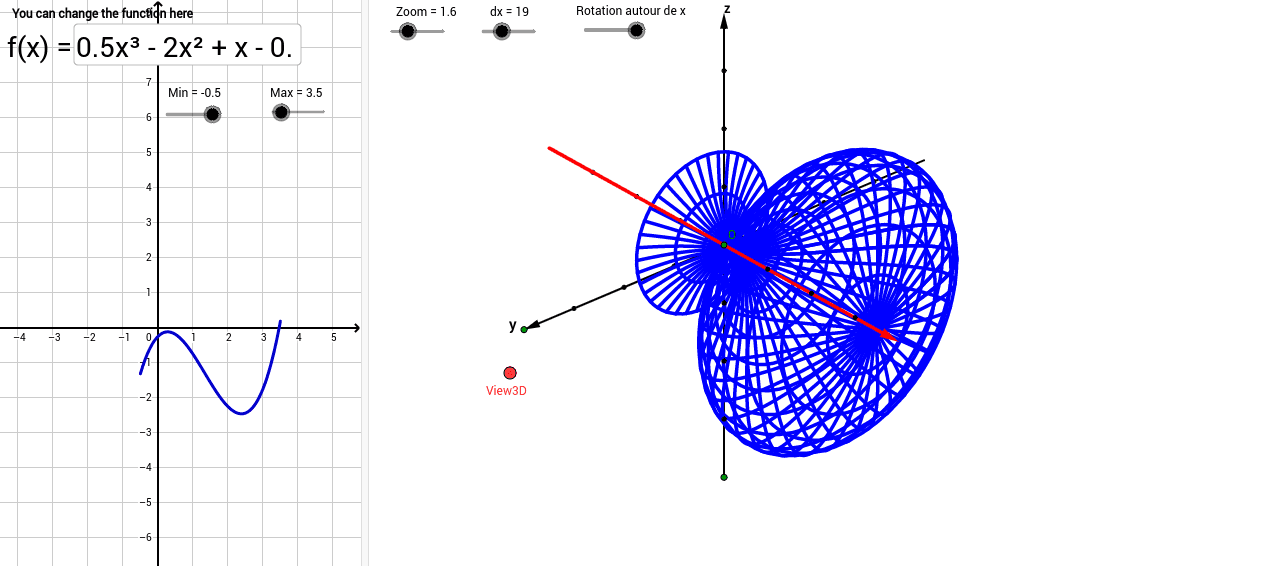
① This example demonstrates the solid generated by rotating an arbitrary function around the x‑axis and shows its volume in real time. ② Core mathematical concepts include definite integrals for volume, solids of revolution, and the interplay between function graphs and solid geometry. ③ Construction highlights: the function is defined with Function; slices are created via Sequence; Vector, OrthogonalLine, Translate, Mirror, Segment, Point, Line, Intersect, and Textfield build the 3D rotation view and interactive input. ④ Suitable for high‑school calculus, university multivariable calculus lectures, and self‑study of volume integration visualization.
GeoGebra Commands & Parameters
Vector(B_1, X) → u_1Vector(B_1, Z) → wOrthogonalLine(View3D, yAxis) → aOrthogonalLine(View3D, xAxis) → bVector(B_1, Y) → vTranslate(O, Vector[u * u_1]) → O'_1Translate(O, Vector[u * v]) → O'_2Vector(O, O'_2) → zVector(O, O'_1) → dTranslate(O, Vector[u * w]) → O'_3Vector(O, O'_3) → eMirror(O'_1, O) → GMirror(O, O'_2) → O'_4Translate(O, Vector[-u * w]) → O'_5Translate(O, Vector[-u * v]) → O'Segment(O, O'_5) → iSegment(O, O') → jPoint(xAxis) → HLine(H, yAxis) → lPoint(xAxis) → ISequence(O + i * v, i, -3, 3) → liste5Sequence(O + i * w, i, -3, 3) → liste6Sequence(O + i * u_1, i, -3, 3) → liste7Intersect(xAxis, yAxis) → JPoint(yAxis) → KPoint(yAxis) → LVector(K, L) → qPoint(xAxis) → MVector(I, M) → rSequence((x(J) + i, y(J)), i, -3, 3) → liste8Sequence((x(J), y(J) + i), i, -3, 3) → liste9Function(f, Min, Max) → pMirror(O'_1, O) → NSegment(N, O) → n_1Sequence(CurveCartesian[x(O + t * u_1 + f(t) * cos(s) * v - f(t) * sin(s) * w), y(O + t * u_1 + f(t) * cos(s) * v - f(t) * sin(s) * w), t, Min, Max], s, 0, 2 * 3.141592653589793 * Rot / 24, 3.141592653589793 / dx) → liste10Sequence(CurveCartesian[x(O + t * u_1 + f(t) * cos(s) * v - f(t) * sin(s) * w), y(O + t * u_1 + f(t) * cos(s) * v - f(t) * sin(s) * w), s, 0, 2 * 3.141592653589793 * m / 24], t, Min, Max, (Max - Min) / dx) → liste11Textfield(f) → ChampTexte1
AI Drawing Prompt Reference
Draw a 3D visualization of a solid of revolution created by rotating an arbitrary function around the x‑axis, showing the coordinate axes, the function curve in the xy‑plane, the solid built from a stack of circular disks, a text field to edit the function, a slider to adjust the rotation angle or number of slices, and a live display of the computed volume.
The prompt above was compiled from the original drawing commands and is for reference only.