
Roots and Stationary Points of Curves
Loading the math board and drawing, please wait…
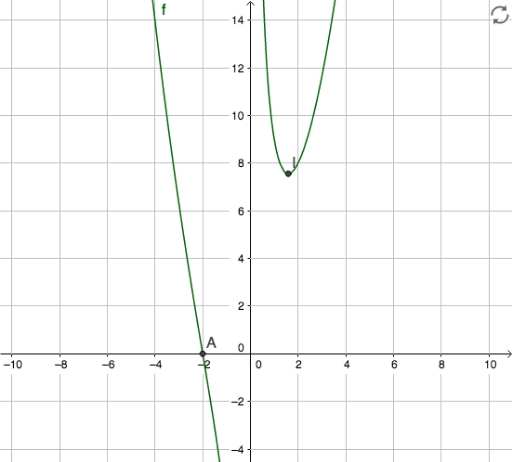
This example demonstrates how to graph a function curve using GeoGebra and label its roots (zeros) and stationary points (extrema). Key math concepts include function graphs, roots, stationary points, derivatives, and extrema. The construction involves commands like Roots and Extremum, with objects such as f, A, B, M, I, and others. It is suitable for high school and above, focusing on function properties and calculus applications.
GeoGebra Commands & Parameters
Roots(f) → AExtremum(f) → B, MRoots(g) → CExtremum(g) → D, NRoots(h) → EExtremum(h) → F, ORoots(p) → GExtremum(p) → H, P
AI Drawing Prompt Reference
Draw a function curve and label its zeros (roots) and stationary points (extrema), then draw three similar function curves and label their zeros and extrema, using different colors for all zeros and extrema. Start with the main function curve and its zeros and extrema, then proceed with the other three curves.
The prompt above was compiled from the original drawing commands and is for reference only.