
Root Functions
Loading the math board and drawing, please wait…
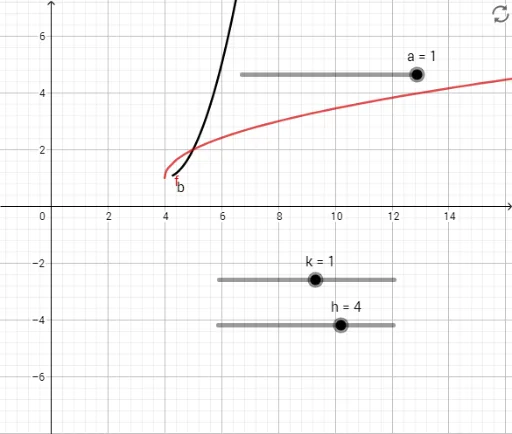
This example demonstrates the graph and properties of root functions, which are a type of power function in the form f(x) = x^(1/n), where n is a positive integer. By adjusting parameters, observe how the graph changes for different n values. The example uses GeoGebra objects h, k, a, f, b to construct the function graph. Suitable for high school math education to help students understand the basic concepts and graph characteristics of root functions.
GeoGebra Commands & Parameters
Numeric h(4)Numeric k(1)Numeric a(1)f(x) = (a * sqrt(x - h)) + kb: x = (a * sqrt(y - k)) + h
AI Drawing Prompt Reference
Draw the graph of a root function to show how changes in parameters affect its shape. Start by plotting the basic coordinate axes, then create the graph of the function f(x) = a√(x-h) + k using values for a, h, and k, highlighting its root function properties. Next, plot the inverse function b: x = a√(y-k) + h to observe its relationship with the original function, demonstrating the symmetry of root functions.
The prompt above was compiled from the original drawing commands and is for reference only.