
Rolling a Number Cube Simulation
Loading the math board and drawing, please wait…
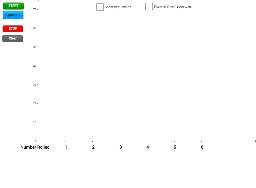
This is a simulation of rolling a fair number cube, allowing students to compare relative frequencies for small and large numbers of trials. Key mathematical concepts include probability and statistics. Using GeoGebra commands such as Frequency and BarChart, the distribution can be visually demonstrated. Suitable for middle school and above students for probability and statistics learning.
GeoGebra Commands & Parameters
Frequency({2, 2}, dlist) → TwosElement(Twos, 1) → NumTwosFrequency({1, 1}, dlist) → OnesElement(Ones, 1) → NumOnesUnique(dlist) → list1Frequency(dlist) → dfreqIf(dlist ≟ {}, 0.1, Sum[dfreq]) → sumRandom(0, Marbles - 1) → Red1Random(0, Marbles - Red1) → Blue2Random(0, Marbles - Blue2 - Red1) → Yellow3Random(0, Marbles - Yellow3 - Blue2 - Red1) → Black4Random(0, Marbles - Black4 - Yellow3 - Blue2 - Red1) → White5BarChart(dlist, 0.8) → bAppend(row1, "TOTAL") → row1aAppend(row2, sum) → row2aTableText({row1a, row2a}, "c_") → text2Random(0, Marbles - 1) → aRandom(0, Marbles - 1) → cRandom(0, Marbles - 1) → dRandom(0, Marbles - 1) → eRandom(0, Marbles - 1) → fRandom(0, Marbles - 1) → gRandom(0, Marbles - 1) → hRandom(0, Marbles - 1) → iRandom(0, Marbles - 1) → jRandom(0, Marbles - 1) → kTableText({row0, row1, row2, row3, row4, row5, row6}, "c_") → AnswersRandomDiscrete({1, 2, 3, 4, 5, 6}, {1 / 6, 1 / 6, 1 / 6, 1 / 6, 1 / 6, 1 / 6}) → Outcome1Frequency({3, 3}, dlist) → ThreesFrequency({4, 4}, dlist) → FoursFrequency({5, 5}, dlist) → FivesFrequency({6, 6}, dlist) → SixesElement(Threes, 1) → NumThreesElement(Fours, 1) → NumFoursElement(Fives, 1) → NumFivesElement(Sixes, 1) → NumSixesText(NumOnes) → text13Text(NumTwos) → text14Text(NumThrees) → text15Text(NumFours) → text16Text(NumFives) → text17Text(NumSixes) → text18Text(FreqOne) → text19Text(FreqTwo) → text20Text(FreqThree) → text21Text(FreqFour) → text22Text(FreqFive) → text23Text(FreqSix) → text24Text(("Total = " * sum)) → text27
AI Drawing Prompt Reference
Create a statistical chart simulating a dice roll, showing the frequency of each number from 1 to 6. Use a bar chart to represent the relative frequency of each number, and add a table displaying the total count for each number and the total number of trials. The chart should clearly illustrate probability and statistics concepts, suitable for educational demonstration.
The prompt above was compiled from the original drawing commands and is for reference only.