
Robbery Riddler Expected Value
Loading the math board and drawing, please wait…
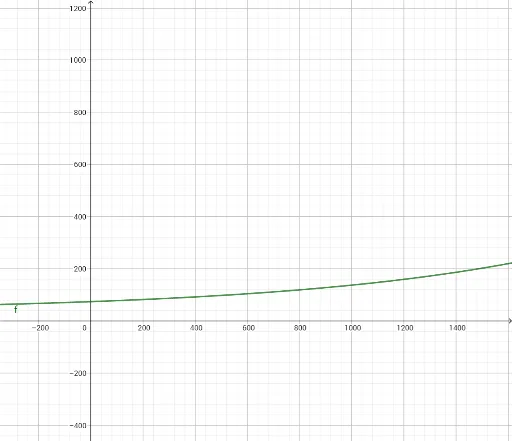
This example demonstrates how to construct and visualize complex mathematical models involving expected value using GeoGebra. Key math concepts include expected value calculation, 3D shape construction, logarithms, Poisson distribution, and interest calculation. The construction leverages GeoGebra objects f (function), a (parameter), and text1 (text label). Suitable for high school students and educators for teaching probability & statistics and advanced mathematics.
GeoGebra Commands & Parameters
f(x) = 74 + (((1 - (998 / 999)^(x - 1)) * (998 / 999)^(1000 - x)) * 100.1)f(1000)
AI Drawing Prompt Reference
Create a complex 3D geometric model with a function f(x) representing expected values from 1 to 1000. The function reaches its maximum at x=1000. Also include a text label to explain the calculation of expected values.
The prompt above was compiled from the original drawing commands and is for reference only.