
Rhombus Max Gonzalez: Median Lines and Parametric Curves for Area Exploration
Loading the math board and drawing, please wait…
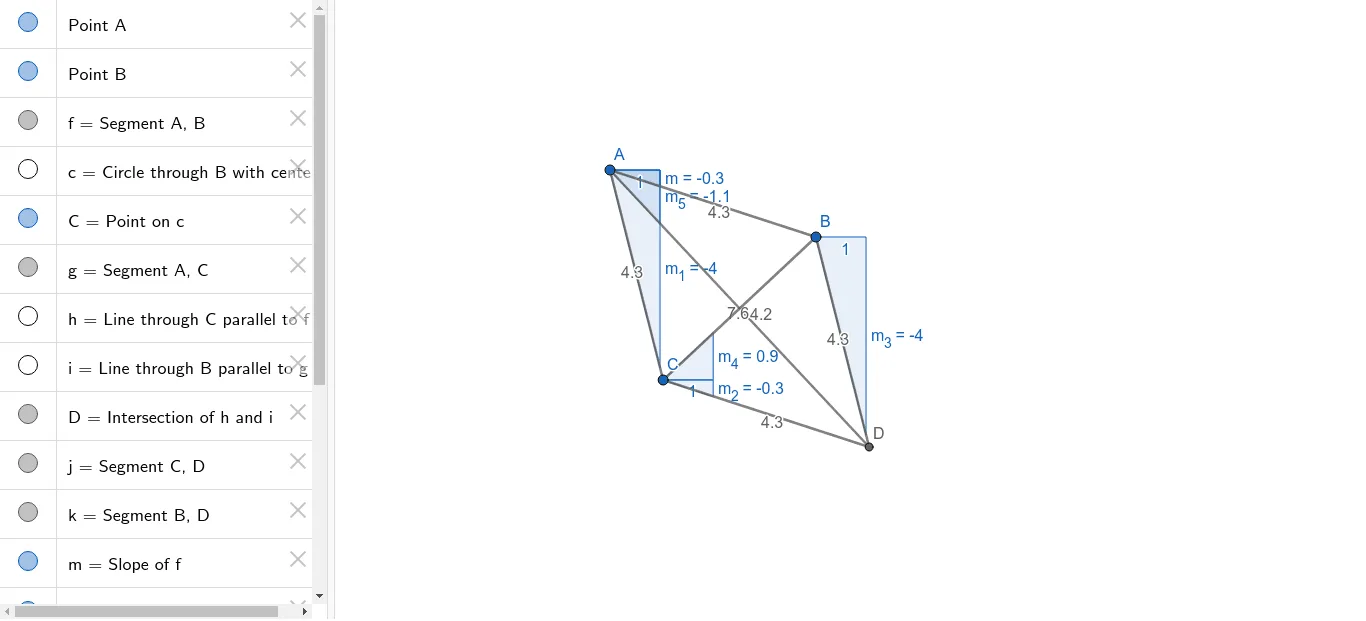
This GeoGebra example demonstrates the construction of a rhombus and explores its area and related geometric properties using median lines and parametric curves. The core mathematical concepts include the definition and properties of a rhombus, the role of median lines in geometric figures, the plotting of parametric curves, and an analogy to interest calculation for area computation. The construction uses GeoGebra commands such as Segment, Circle, Point, Line, Intersect, and Slope, creating objects like points A and B, segment f, circle c, intersection point C, and multiple auxiliary lines (g, h, i, j, k, m) to build the full model. Slope measurements and objects m_1 through m_5 are used to analyze the geometry. This example is suitable for middle or high school geometry classes, helping students visualize the derivation of the rhombus area formula, understand the significance of median lines, and see how parametric representations can be applied in dynamic geometry.
GeoGebra Commands & Parameters
Segment(A, B) → fCircle(A, B) → cPoint(c) → CSegment(A, C) → gLine(C, f) → hLine(B, g) → iIntersect(h, i) → DSegment(C, D) → jSegment(B, D) → kSlope(f) → mSlope(g) → m_1Slope(j) → m_2Slope(k) → m_3Segment(A, D) → lSegment(C, B) → nSlope(n) → m_4Slope(l) → m_5
AI Drawing Prompt Reference
Draw a rhombus and display its diagonals. Create the perpendicular bisector of one side of the rhombus and find the intersection point with the opposite side. Connect this point to the vertices of the rhombus to form auxiliary lines. Measure and label the slopes of these lines to analyze the geometry. Additionally, plot parametric curves to explore the area calculation of the rhombus, analogous to interest calculation.
The prompt above was compiled from the original drawing commands and is for reference only.