
Rhombus and Inequality Demo
Loading the math board and drawing, please wait…
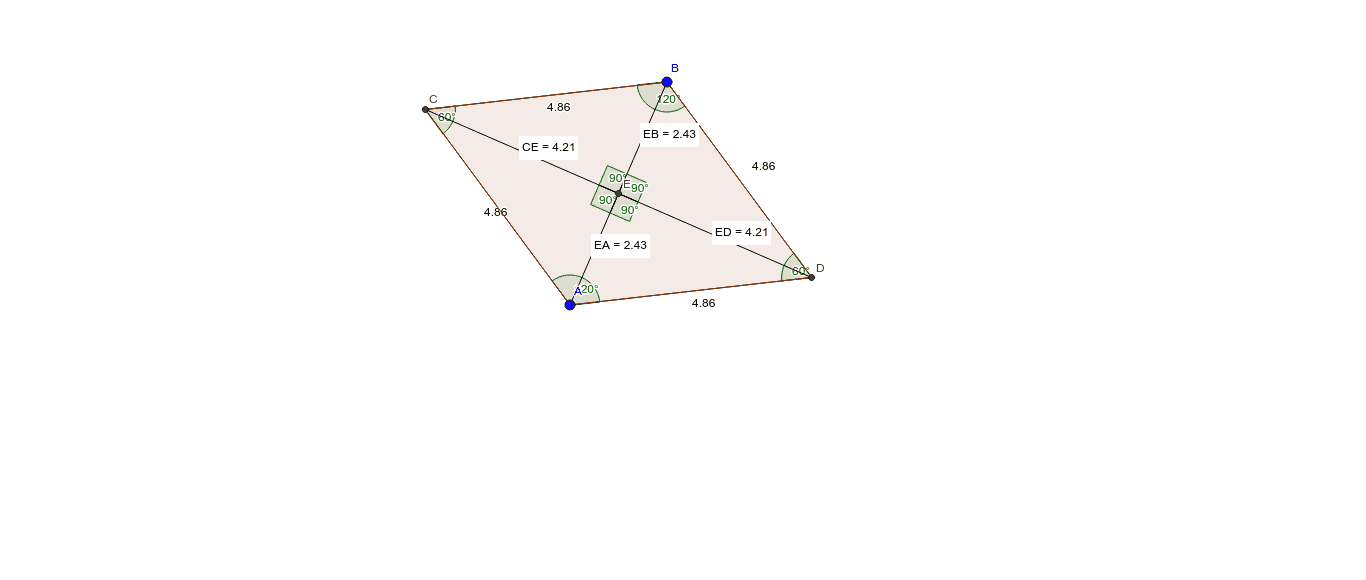
This example demonstrates the geometric properties of a rhombus and its relationship with inequalities. Key math concepts include symmetry of the rhombus, inequalities, vectors, curve sketching, bar charts, and functions. Construction highlights involve GeoGebra commands like Circle, Intersect, Segment, Polygon, Angle, and Distance to build the rhombus and related graphics. Suitable for high school mathematics teaching, integrating geometric construction with function graphs.
GeoGebra Commands & Parameters
Circle(A, B) → cCircle(B, A) → dIntersect(c, d) → C, D, ,Segment(C, A) → aSegment(C, B) → bSegment(D, B) → eSegment(A, D) → fPolygon(A, C, B, D) → poly1, a_1, c_1, b_1, d_1Angle(poly1) → α, β, γ, δSegment(C, D) → gSegment(B, A) → hIntersect(g, h) → EDistance(C, E) → distanceCEDistance(E, B) → distanceEBDistance(E, D) → distanceEDDistance(E, A) → distanceEAAngle(C, E, A) → εAngle(D, E, B) → ζAngle(B, E, C) → ηAngle(A, E, D) → θ
AI Drawing Prompt Reference
Draw a rhombus and demonstrate its relationship with inequalities. Start by creating two intersecting circles to form the vertices of the rhombus, then connect these points to outline the shape. Next, highlight the diagonals and their intersection point, calculating the distances and angles involved. Finally, use distinct styles for different parts of the rhombus and include function graphs and bar charts related to inequalities, showing the integration of geometric construction with graphical representations.
The prompt above was compiled from the original drawing commands and is for reference only.