
Representing Ratios with Diagrams: IM 6.2.2 Lesson
Loading the math board and drawing, please wait…
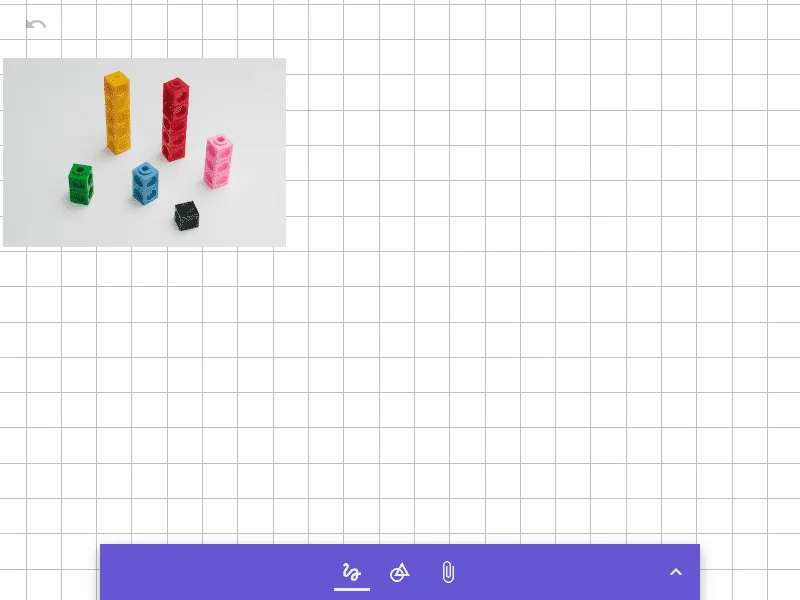
① This example demonstrates how to use diagrams, such as bar models or double number lines, to visually represent the relationship between two quantities in a ratio. ② The core mathematical concept is ratio, including part-to-part and part-to-whole relationships, and equivalent ratios. ③ Construction: Based on the summary, the GeoGebra file includes an image object (pic1) likely used as a visual aid; the construction may involve drawing rectangles or bars to model ratios, though specific commands are not detailed. ④ This is suitable for middle school students (Grade 6) learning ratios, and can be used for classroom instruction or self-study to build a concrete understanding of ratio concepts.
AI Drawing Prompt Reference
Create a visual diagram to represent a ratio between two quantities. Use bar models or double number lines, with two rectangles of different lengths or colors to show the two quantities, and label the ratio relationship. For instance, place two bars side by side, one for each quantity, with lengths proportional to the given ratio. Add tick marks or dashed lines to indicate equivalent ratios. The diagram should clearly show part-to-part or part-to-whole relationships, suitable for sixth-grade students learning ratios.
The prompt above was compiled from the original drawing commands and is for reference only.