
Representation of a Cubic Polynomial
Loading the math board and drawing, please wait…
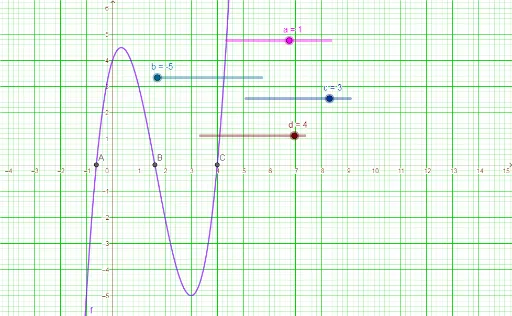
This example demonstrates how to graph and analyze a cubic polynomial and its roots using GeoGebra. Key math concepts include polynomial functions, roots, derivatives, slopes, and median lines. The construction uses GeoGebra commands Root and objects a, b, c, d, f, A, B, C. Suitable for high school mathematics teaching to understand the properties and characteristics of cubic function graphs.
GeoGebra Commands & Parameters
Root(f) → A, B, C
AI Drawing Prompt Reference
Draw the graph of a cubic polynomial function, showing its smooth curve with one local maximum and one local minimum. Mark all points where the curve intersects the x-axis with distinct dots, representing the three real roots. The graph should clearly illustrate the function's increasing and decreasing intervals and its inflection behavior, suitable for high school math analysis of cubic functions.
The prompt above was compiled from the original drawing commands and is for reference only.