
Relative Error in Geometry and Statistics
Loading the math board and drawing, please wait…
In collections
The Domain of the Time (intuitive kinematics)
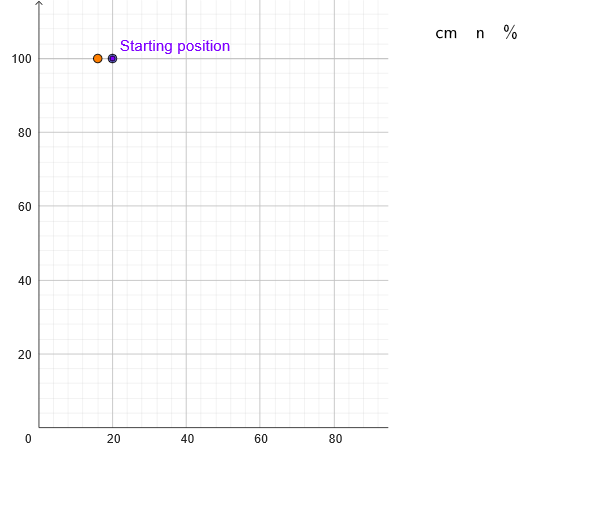
This example demonstrates relative error through geometric construction and statistical charts. Key mathematical concepts include vectors, limits, statistical features, and geometric construction. The construction involves using GeoGebra commands like PointIn, Sequence, and TableText to build the graph and analyze error distribution. Suitable for high school students or college undergraduates to understand error analysis in geometry and statistics.
GeoGebra Commands & Parameters
PointIn(x ≥ 0 ∧ y ≥ 0) → PSequence(Segment[(x(P), marca(k)), (x(P) + x(Corner[2] - Corner[1]) / 20, marca(k))], k, 1, Length[marca]) → marcasSequence(Text[("" * reg(k)) + "''", (x(P) + x(Corner[2] - Corner[1]) / 18, marca(k))], k, 1, Length[marca]) → marcasNSequence(Segment[(x(P), y(P) - (4.905 * k^(2))), (0, y(P) - (4.905 * k^(2)))], k, 1, Length[marca]) → marcasTTableText(Join[{{"cm"}, (100 * Last[regD, Min[10, Length[regD] - 1]])}], Join[{{"n"}, Last[regN, Min[10, Length[regN] - 1]]}], Join[{{"%"}, 100 / Last[regN, Min[10, Length[regN] - 1]]}], "v") → texto3
AI Drawing Prompt Reference
Draw a graph of relative error, including a square region and a parabola. The square region has a marked point at its lower left corner, with both x and y coordinates being positive numbers. Inside the square region, there are points in a sequence, with x coordinates starting from the marked point and extending to the right, and y coordinates changing according to the sequence's k value, following a parabolic rule. Above the sequence points, there are text elements in another sequence, with text content being the sequence's k values, starting from 1 and extending upwards. Inside the square region, there is a parabola with its vertex at the upper left of the marked point, following the equation y = -4.905x^2. Draw all points and text elements inside the square region, including the sequence points and text, as well as the parabola.
The prompt above was compiled from the original drawing commands and is for reference only.