
Relationship Between Logarithmic and Exponential Functions
Loading the math board and drawing, please wait…
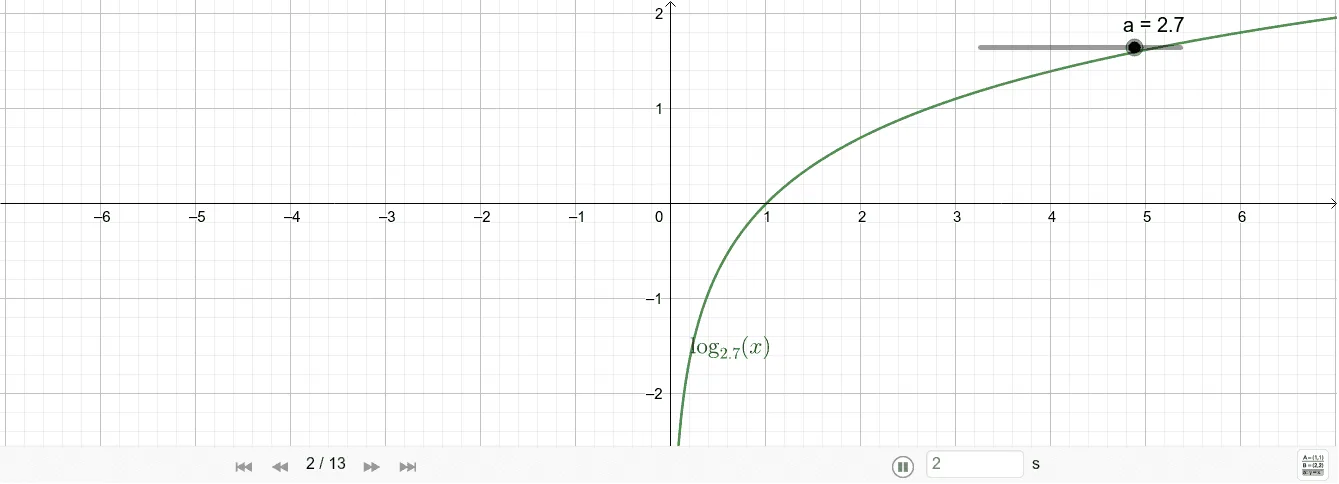
① This GeoGebra example visually demonstrates that logarithmic and exponential functions are inverse functions, with their graphs symmetric about the line y = x. ② Core mathematical concepts include logarithmic functions, exponential functions, inverse functions, reflection symmetry, and measuring distances from points to the origin. ③ Construction details: using the Point command to place a point A on the exponential curve, the Mirror command to reflect A across y = x to obtain A', then Midpoint, Segment, and Distance commands to construct and measure segments AO and A'O, with Text commands displaying the distances to verify symmetry. ④ Suitable for high school students (e.g., Indonesian SMA curriculum) learning function properties, and useful for classroom demonstrations or student-led exploration of inverse function graphs.
GeoGebra Commands & Parameters
Point(f) → AMirror(A, h) → A'Midpoint(A, A') → OSegment(A', O) → iSegment(O, A) → jDistance(A', O) → distanceA'ODistance(A, O) → distanceAO
AI Drawing Prompt Reference
Draw a coordinate plane with an exponential curve and a logarithmic curve, along with the line y=x as the axis of symmetry. Place a point on the exponential curve, then reflect it across the line y=x to get its mirror image. Connect both points to the origin with line segments, and measure the lengths of these two segments. Display the two distance values as text labels near the segments to show they are equal, illustrating that the exponential and logarithmic functions are inverses with graphs symmetric about y=x.
The prompt above was compiled from the original drawing commands and is for reference only.