
Relationship Between Binomial and Normal Distributions
Loading the math board and drawing, please wait…
In collections
GGBChat4: Statistics 1
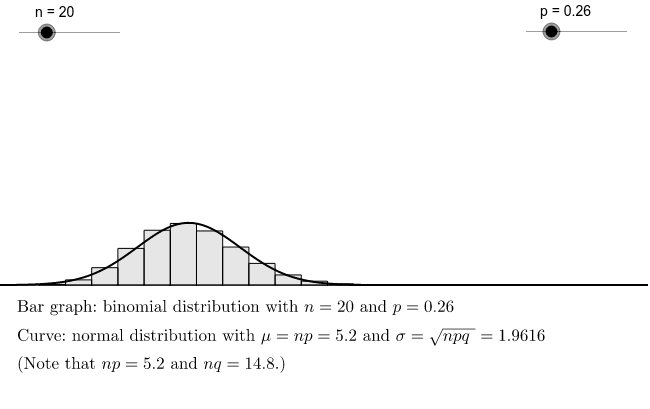
This example visually demonstrates the relationship between binomial and normal probability distributions, illustrating how well they approximate each other under certain conditions. Key math concepts include binomial distribution, normal distribution, probability & statistics, statistical characteristics. It is constructed using BarChart commands to plot histograms, involving objects like n, p, f, b, c, text1, np, npq, sqrtnpq, nq, text2, and slider animations to show distribution changes. Suitable for high school and above learners to understand distribution relationships and approximation in probability statistics.
GeoGebra Commands & Parameters
BarChart(Sequence[i / n, i, 0, n], Sequence[n * BinomialDist[n, p, i, false], i, 0, n]) → b
AI Drawing Prompt Reference
Create a chart to visualize the relationship between binomial and normal distributions by comparing their probability histograms, use a slider to adjust parameters, and display the approximation of one to another under different conditions, labeling key statistical measures like np and npq for understanding the distribution relationships and statistical characteristics.
The prompt above was compiled from the original drawing commands and is for reference only.