
Related Rates - Square
Loading the math board and drawing, please wait…
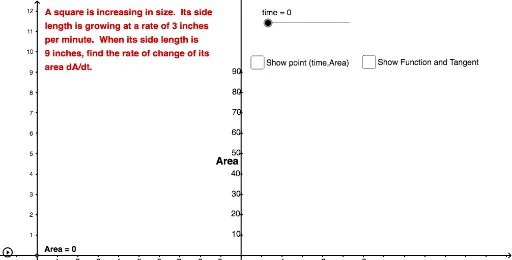
This example demonstrates the relationship between the side length and diagonal length of a square as the side length changes over time, focusing on related rates in calculus. Key mathematical concepts include derivatives, geometric relationships, and dynamic modeling. GeoGebra commands like Intersect, Point, Line, Function, Tangent, Polygon, Circle, Segment, and Slope are used to construct the model. Suitable for high school students and above learning calculus and geometric applications, or for educational demonstrations.
GeoGebra Commands & Parameters
Intersect(xAxis, yAxis) → APoint(xAxis) → ELine(E, yAxis) → ePoint(e) → FPoint(e) → IPoint(e) → JPoint(e) → KPoint(e) → MPoint(e) → NFunction(((2.25 * x^(2)) - (45 * x) + 225) / 10, 10, 16) → fTangent(O, f) → aPoint(a) → PPoint(a) → QPolygon(A, B, C, D) → poly1, a_1, b, c, dTangent(O, f) → gCircle(O, 3) → hIntersect(h, g) → R, SSegment(R, S) → iSlope(g) → m
AI Drawing Prompt Reference
Draw a square and dynamically show the diagonal length as the side length changes. Use a function to depict the relationship between side length and diagonal length, draw the tangent to the function, mark the tangent point, and use the slope of the tangent to represent the rate of change.
The prompt above was compiled from the original drawing commands and is for reference only.