
Related Rates of Boat
Loading the math board and drawing, please wait…
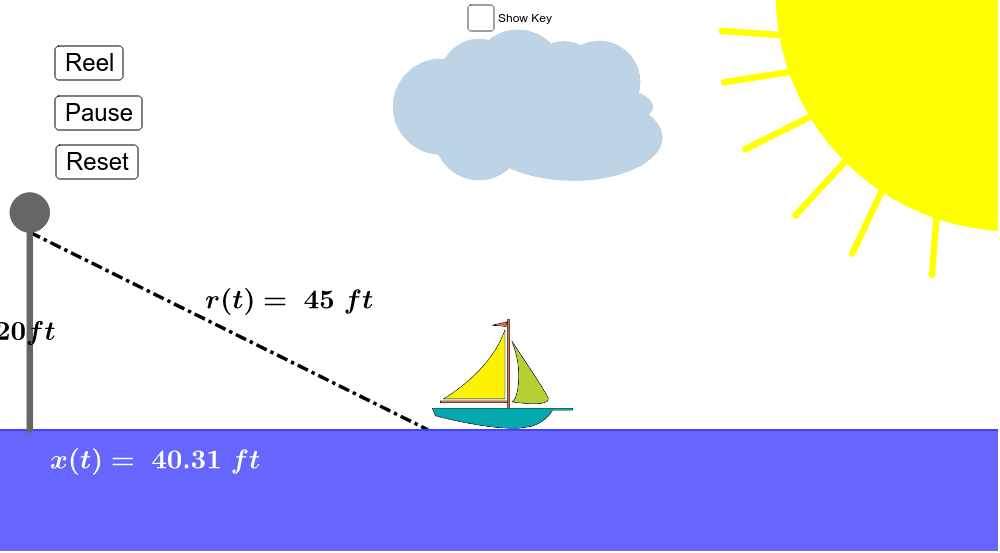
This example demonstrates the changes in the speed of a boat relative to an observer on the shore. Key mathematical concepts include related rates. Using GeoGebra commands such as Point, Circle, Segment, Polygon, etc., a dynamic model of the boat, the observer, and the water waves is constructed. Suitable for high school mathematics education, particularly for calculus and related rates.
GeoGebra Commands & Parameters
Point(yAxis) → ACircle(B, A) → cSegment(B, A) → aSegment(A, C) → rPoint(xAxis) → EPoint(xAxis) → FPolygon(E, F, G, H) → poly1, e, f, g, hCircleArc(I, J, K) → kPolygon(I, J, K) → poly2, k_1, i, jIntersect(k, i, 1) → LSegment(M, N) → bEllipse(T, U, V) → qEllipse(W, Z, A_1) → sCircle(B_1, C_1) → tIntersect(q, t, 1) → D_1Intersect(q, t, 1) → E_1Circle(D_1, F_1) → c_1Intersect(q, t, 2) → G_1Intersect(s, q, 1) → H_1Point(q) → I_1Circle(G_1, I_1) → d_1Intersect(s, q, 1) → J_1Intersect(s, q, 1) → K_1Point(q) → L_1Circle(I_1, L_1) → e_1Intersect(s, q, 2) → M_1Point(q) → N_1Circle(L_1, N_1) → f_1Intersect(s, q, 2) → O_1Point(q) → P_1Circle(N_1, P_1) → g_1Point(r) → Q_1Segment(A, R_1) → a_1Segment(A, R_1) → b_1Point(b) → OCircle(O, V_1) → pPoint(p) → S_1Segment(O, S_1) → lPoint(p) → T_1Segment(O, T_1) → mPoint(p) → U_1Segment(O, U_1) → nPoint(p) → W_1Segment(O, W_1) → h_1Point(p) → Z_1Segment(O, Z_1) → i_1Point(p) → A_2Segment(O, A_2) → j_1
AI Drawing Prompt Reference
Draw a dynamic graph showing a boat, an observer, and water waves. The boat and observer are on a straight line, with the boat's position changing over time. The water waves appear as ellipses intersecting the boat and observer. The graph should include the boat, observer, water wave ellipses, and their intersection points. The construction order is: first draw points, then circles and line segments, then ellipses, and finally determine intersection points.
The prompt above was compiled from the original drawing commands and is for reference only.