
Rekenrek Addition Demo
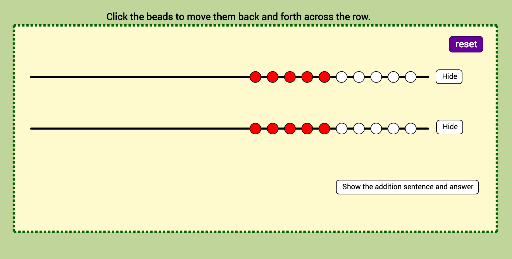
Loading the math board and drawing, please wait…
This example demonstrates the use of a Rekenrek for addition, visually representing number combinations and operations. It involves core math concepts like addition, number grouping, and visual learning. Constructed using GeoGebra commands such as Segment, Point, Sum, and Polygon. Suitable for lower elementary mathematics education to intuitively understand addition processes.
GeoGebra Commands & Parameters
Segment((0, 11), (23, 11)) → fPoint(f) → APoint(f) → BPoint(f) → CPoint(f) → DPoint(f) → EPoint(f) → FPoint(f) → IPoint(f) → JPoint(f) → GPoint(f) → HPoint(f) → KPoint(f) → LPoint(f) → MPoint(f) → NPoint(f) → OPoint(f) → PPoint(f) → QPoint(f) → RPoint(f) → SPoint(f) → TSum(row1list) → row1valueSegment((0, 8), (23, 8)) → gPoint(g) → UPoint(g) → VPoint(g) → WPoint(g) → ZPoint(g) → A_1Point(g) → B_1Point(g) → C_1Point(g) → D_1Point(g) → E_1Point(g) → F_1Point(g) → G_1Point(g) → H_1Point(g) → I_1Point(g) → J_1Point(g) → K_1Point(g) → L_1Point(g) → M_1Point(g) → N_1Point(g) → O_1Point(g) → P_1Sum(row2list) → row2valuePolygon(Q_1, R_1, S_1, T_1) → poly1, q_1, r_1, s_1, t_1