
Reasoning About Exponential Graphs (Part 1): Read Parameters from Shape
Loading the math board and drawing, please wait…
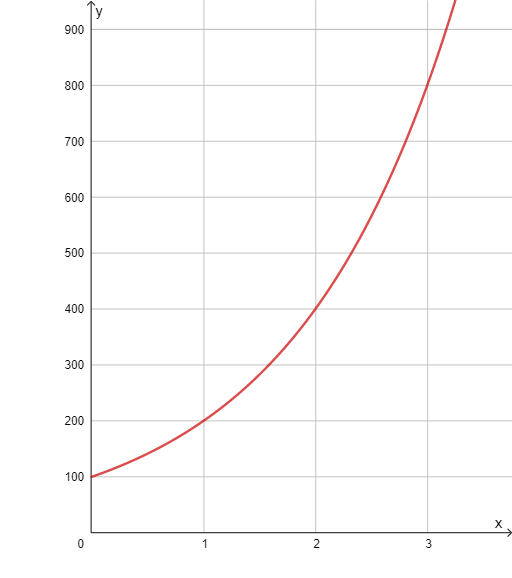
This example demonstrates how to reason from the shape of an exponential graph to infer qualitative behavior and understand how parameters affect the curve. It focuses on core ideas of exponential functions—growth vs. decay, key features such as intercept behavior and asymptotic tendencies—and the broader skill of interpreting mathematical expressions through graph geometry. The construction centers on a function object, indicated by the GeoGebra construction summary (“object: f”), meaning the activity is primarily built by defining and visualizing an exponential function in GeoGebra and using the resulting graph to guide reasoning and comparison between different cases. Suitable for upper secondary to pre-university levels, and also useful for tutoring and self-study on function graphing and interpretation.
GeoGebra Commands & Parameters
f(x) = If[x > 0, (100 * 2^(x))]
AI Drawing Prompt Reference
Draw an exponential function graph showing growth for x > 0. Include the curve, axes, and key points like the y-intercept and asymptote. The construction order is to draw the axes first, then the curve, and finally label the features.
The prompt above was compiled from the original drawing commands and is for reference only.