
Real Numbers Venn Diagram
Loading the math board and drawing, please wait…
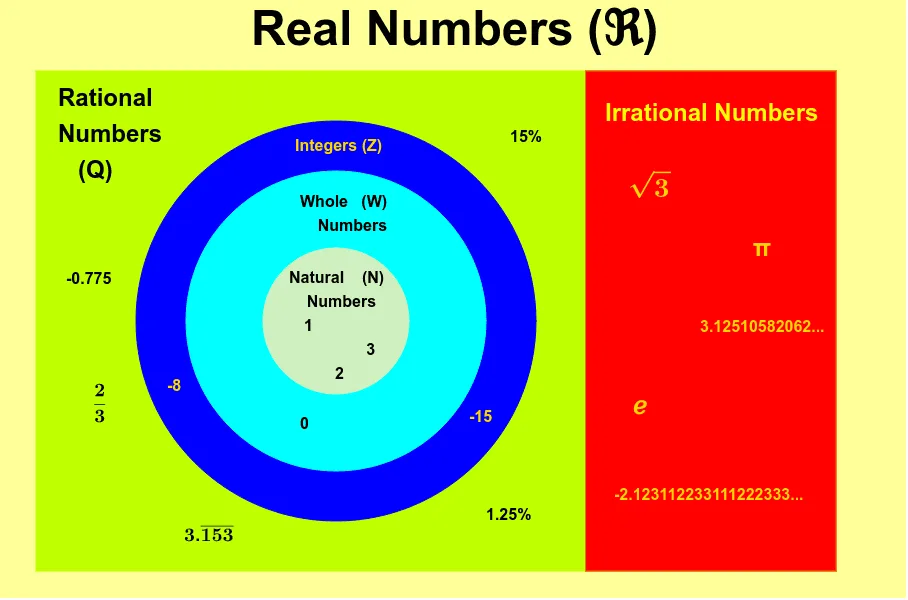
This example demonstrates the classification and representation of real numbers in a Venn diagram. Key math concepts include set theory and real number classification (rational, irrational numbers). Construction highlights involve using GeoGebra commands like Circle, Point, Polygon to build the Venn diagram framework, and Intersect to show intersections between sets. Suitable for high school mathematics teaching to help students understand set operations and real number categories.
GeoGebra Commands & Parameters
Intersect(xAxis, yAxis) → ACircle(A, B) → cPoint(xAxis) → CCircle(A, C) → dCircle(A, D) → ePolygon(E, F, G, H) → poly1, e_1, f, g, hPoint(g) → IPoint(e_1) → JPolygon(I, J, F, G) → poly2, i, j, f_1, g_1
AI Drawing Prompt Reference
Draw a Venn diagram with two intersecting circles to represent the classification of real numbers, where one circle contains a smaller one to denote rational and irrational numbers, and use polygons to highlight the intersection areas, including the intersection point of the coordinate axes.
The prompt above was compiled from the original drawing commands and is for reference only.