
Real-life Timetable Problem
Loading the math board and drawing, please wait…
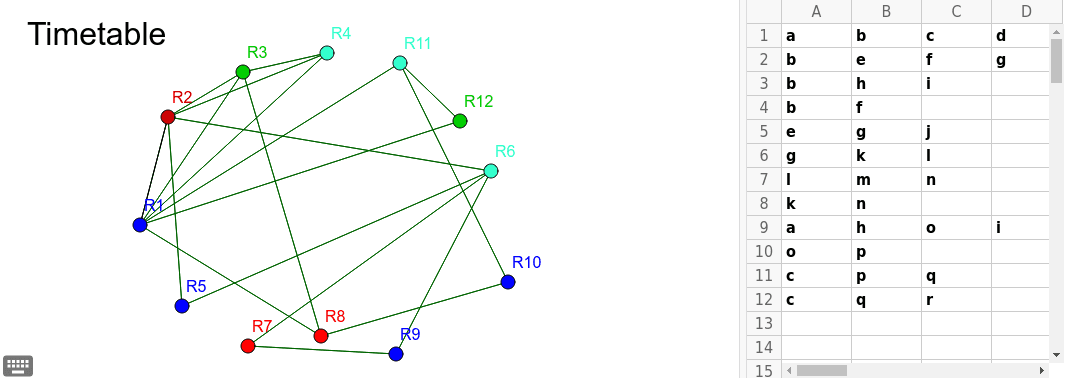
This example demonstrates how to construct and visualize real-life timetables using GeoGebra. It involves core mathematical concepts such as line segments, distributions, median lines, percentages, exponents, and Poisson distributions. The construction utilizes commands like If and Sequence, along with objects like A1, B1, C1, D1, list1, A3, B3, C3, A2, C2, D2, B2, A8, A4, B4, A5, B5, C5, A6, B6, C6, A7, B7, C7, B8, A9, B9, C9, D9, A10, B10, A11, B11, C11, A12, B12, C12, list2, R1, R2. It is suitable for high school students and educators.
GeoGebra Commands & Parameters
If(Intersection[list1, list2] ≠ 0, Segment[R1, R2]) → aSequence(Sequence[If[Intersection[Element[listlist, i], Element[listlist, j]] ≠ {}, Segment[Element[pointlist, i], Element[pointlist, j]]], i, 1, 12], j, 1, 12) → list13