
Random Simple Probability Tester: Find the Fair Dice (Stage 2-3)
Loading the math board and drawing, please wait…
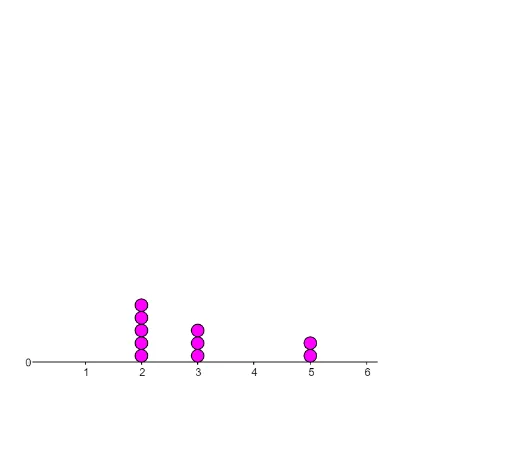
① This example simulates rolling dice to demonstrate how to judge whether a die is fair by analyzing frequency data from repeated random experiments. ② Core math concepts include probability, random experiments, frequency stability, expected value, and data distribution via dot plots, with extensions to set theory and power functions. ③ Construction highlights: using GeoGebra commands such as Textfield, TableText, and DotPlot, the construction includes objects like luckytown, dicerus, highrollers, dicedicebaby, pipsanddots, sliceanddice, rolls, inputBox1, data, a, b, c, d, e, f, nums, list2, text1, text2, list1, and g. The input box controls the number of rolls, lists store outcomes, and counts per face are computed and displayed in a dot plot. ④ Suitable for middle and high school (grades 7-12) probability and statistics lessons, as well as inquiry-based math labs, helping students grasp randomness and the law of large numbers.
GeoGebra Commands & Parameters
Textfield(rolls) → inputBox1TableText({{1, 2, 3, 4, 5, 6}, (list2 * 100)}, "c_|") → text1DotPlot(data, true, Min[100 / rolls, 1]) → list1