
Random Pi Estimation
Loading the math board and drawing, please wait…
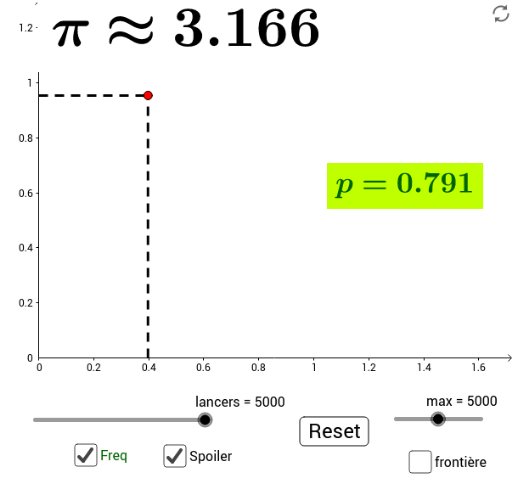
This example demonstrates estimating the value of pi (π) through random data generation. Key mathematical concepts include probability and random number generation. Using GeoGebra commands such as Intersect, Polygon, CircleArc, etc., random points are constructed and their relationship with the circle is calculated to estimate the value of π. Suitable for high school mathematics education and learning probability and statistics.
GeoGebra Commands & Parameters
Intersect(xAxis, yAxis) → APolygon(A, B, 4) → poly1, f, g, h, i, C, DCircleArc(A, B, D) → cCircleSector(A, B, D) → dOrthogonalLine(E, xAxis) → jOrthogonalLine(E, yAxis) → kIntersect(j, xAxis) → FIntersect(k, yAxis) → GSegment(G, E) → lIf(x(E)^(2) + y(E)^(2) < 1, 1, 0) → tSequence(If[RandomUniform[0, 1]^(2) + RandomUniform[0, 1]^(2) < 1, 1, 0], k, 0, max) → dataOrthogonalLine(E, f) → pIntersect(p, f) → HSegment(H, E) → q
AI Drawing Prompt Reference
Draw a coordinate system, and then draw a unit circle inside it. Estimate the value of π by calculating the ratio of points randomly generated inside the circle. Start by drawing the intersection of the x-axis and y-axis, then draw a square, followed by the unit circle and a circular sector. Draw the diagonal of the square, find its intersection with the circle, construct random points, and determine if they are inside the circle. Finally, generate a large number of random points and count how many fall inside the circle to estimate π.
The prompt above was compiled from the original drawing commands and is for reference only.