
Radical Equation Demo
Loading the math board and drawing, please wait…
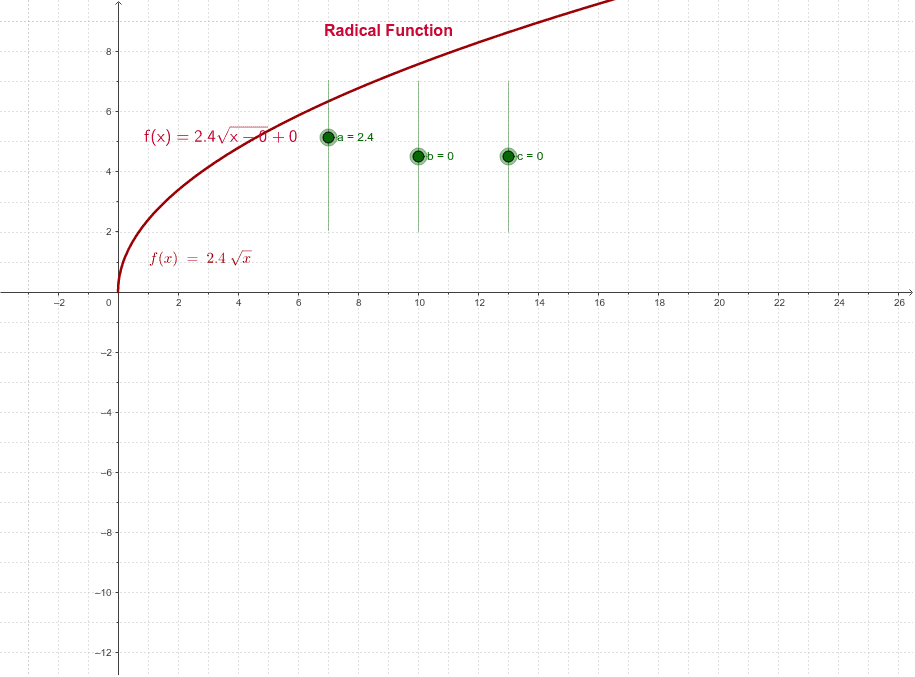
This example demonstrates how adjusting parameters via sliders affects the graph of a radical equation. It covers core math concepts like radical equations, function graph transformations, and the impact of parameters on function shape. Constructed using GeoGebra objects: a, b, c, f, T1, T2, where a, b, c are parameters, f is the function object, and T1, T2 might represent specific points or loci. Suitable for high school mathematics education to visually understand dynamic effects of parameter changes on function graphs and enhance intuitive comprehension of radical equations.
GeoGebra Commands & Parameters
Numeric a(2.4)Numeric b(0.0)Numeric c(0.0)f(x) = a * sqrt(x - b) + c
AI Drawing Prompt Reference
Draw a function graph representing a radical equation where parameters a, b, and c are adjustable via sliders, showing how changes in these parameters affect the graph's shape and position, and mark two specific points or loci to observe the dynamic effects of parameter adjustments on the function.
The prompt above was compiled from the original drawing commands and is for reference only.