
Quiz: Graphing Linear Equations (V1)
Loading the math board and drawing, please wait…
In collections
Graphing Linear Functions
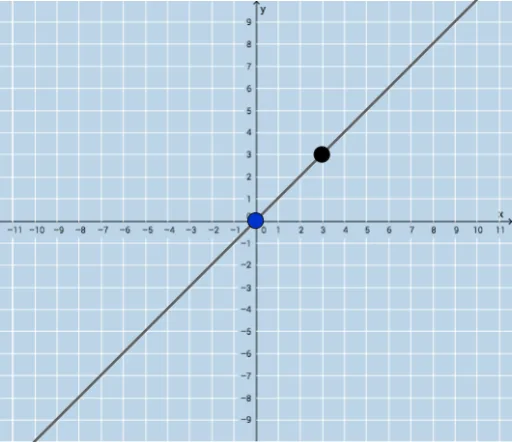
① This interactive applet demonstrates how to graph linear equations using slope and y-intercept, providing instant feedback to students as they practice. ② Core math concepts include the slope-intercept form y=mx+b, the geometric meaning of slope (m) and y-intercept (b), and the relationship between equation parameters and the resulting line on a coordinate plane. ③ Construction details: The applet uses GeoGebra commands such as Sequence, Union, and Random to generate randomized problem parameters, Point and Line to create the graph, FractionText to display slopes as fractions, and button/text objects (button1, text1-5, button2, button3) to enable interactive question generation and answer checking. ④ Suitable for middle school and high school students learning linear functions, as well as for teachers seeking a dynamic classroom demonstration or self-paced practice tool to reinforce understanding of slope and intercept concepts.
GeoGebra Commands & Parameters
Sequence(i, i, -10, -1) → aSequence(i, i, -10, -1) → bSequence(i, i, 1, 10) → cUnion(b, c) → dRandom(-12, 12) → ePoint(x = 0) → ALine(A, B) → gFractionText(Slope[f]) → text1FractionText(f(0)) → text2