
Quiz: Graphing Linear Equations in Standard Form
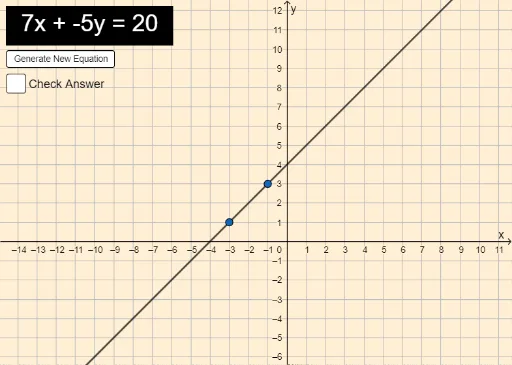
Loading the math board and drawing, please wait…
This example demonstrates how to graph linear equations using slope and y-intercept. Key mathematical concepts include standard form of linear equations, slope-intercept relationship. Construction involves GeoGebra commands like RandomElement, Element, Line, and LaTeX to create equation objects. Suitable for middle school or high school students learning basic linear function graphing skills.
GeoGebra Commands & Parameters
RandomElement(sets) → setElement(set, 3) → constantElement(set, 1) → xCoefElement(set, 2) → yCoefLine(A, B) → currentLineLine(Point[{constant / xCoef, 0}], Point[{0, constant / yCoef}]) → correctLineLaTeX(incorrectText, true, true) → text1
AI Drawing Prompt Reference
Draw a straight line. The line should have a y-intercept and a slope. The y-intercept is a constant, and the slope is the x-coefficient divided by the y-coefficient. The line should start from the y-intercept point and extend to the x-intercept. Make sure the line is clearly visible in the coordinate system and label the key points.
The prompt above was compiled from the original drawing commands and is for reference only.