
Quadratic Roots and y-Intercepts
Loading the math board and drawing, please wait…
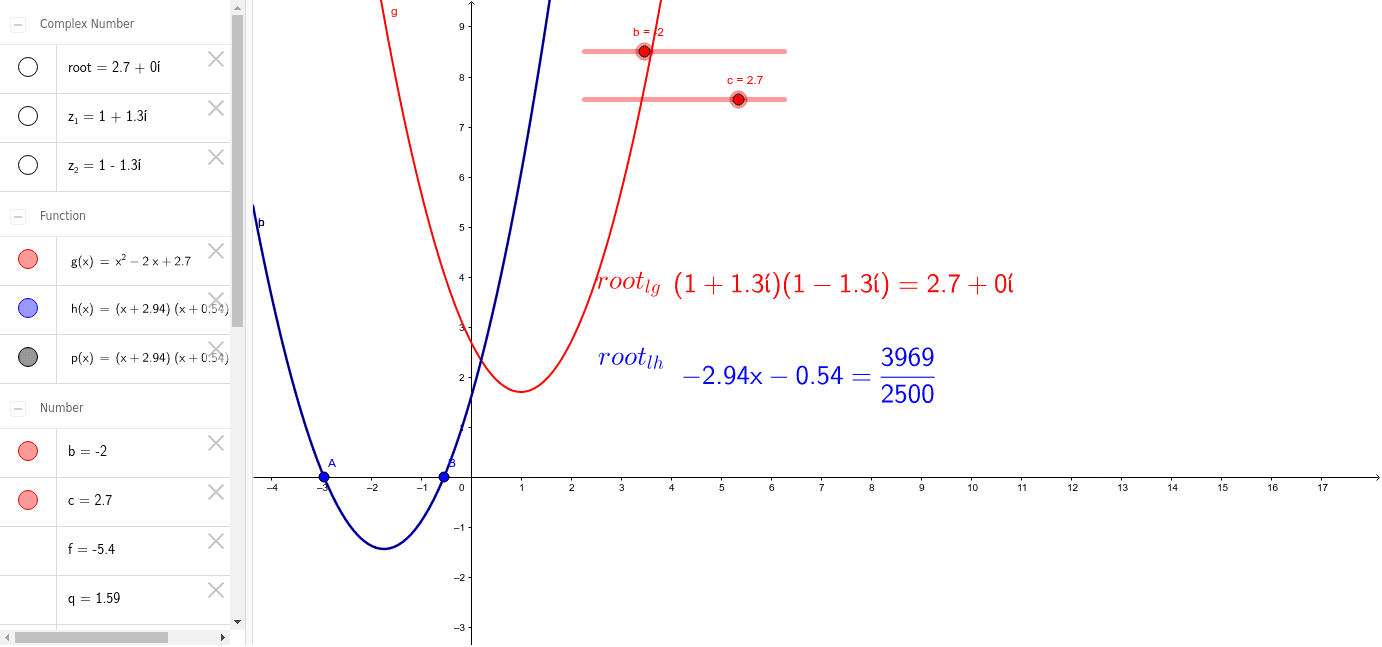
This GeoGebra example visualizes the relationship between the roots of a quadratic function and its y-intercept, demonstrating how the graph interacts with the x-axis and y-axis as coefficients change. Core mathematical concepts include quadratic function properties, discriminant analysis, the nature of real and complex roots, and the geometric interpretation of complex solutions. Construction employs GeoGebra commands such as Point, Root, Expand, ComplexRoot, and FractionText, with dynamic coefficients b and c displayed via input sliders. Root values are shown as exact text or fractions, and complex roots are represented geometrically on the complex plane. The example is suitable for high school algebra and pre-calculus courses, helping students connect algebraic solutions with graphical behavior and understand the transition from real to complex roots.
GeoGebra Commands & Parameters
Point(xAxis) → APoint(xAxis) → BRoot(g) → C, DExpand(h) → pComplexRoot(g) → z_1, z_2FractionText(q) → text5
AI Drawing Prompt Reference
Draw the graph of a quadratic function with two sliders controlling the linear coefficient b and constant term c. Show the curve, its y‑intercept, and the x‑intercepts. When the discriminant is non‑negative, mark the two real roots on the x‑axis and display their exact fractional values. When the discriminant is negative, represent the conjugate complex roots as points on the complex plane and show their algebraic forms. The illustration should reveal how the roots and the y‑intercept change geometrically as the coefficients vary.
The prompt above was compiled from the original drawing commands and is for reference only.