
Quadratic inequalities: solving x²+bx=c
Loading the math board and drawing, please wait…
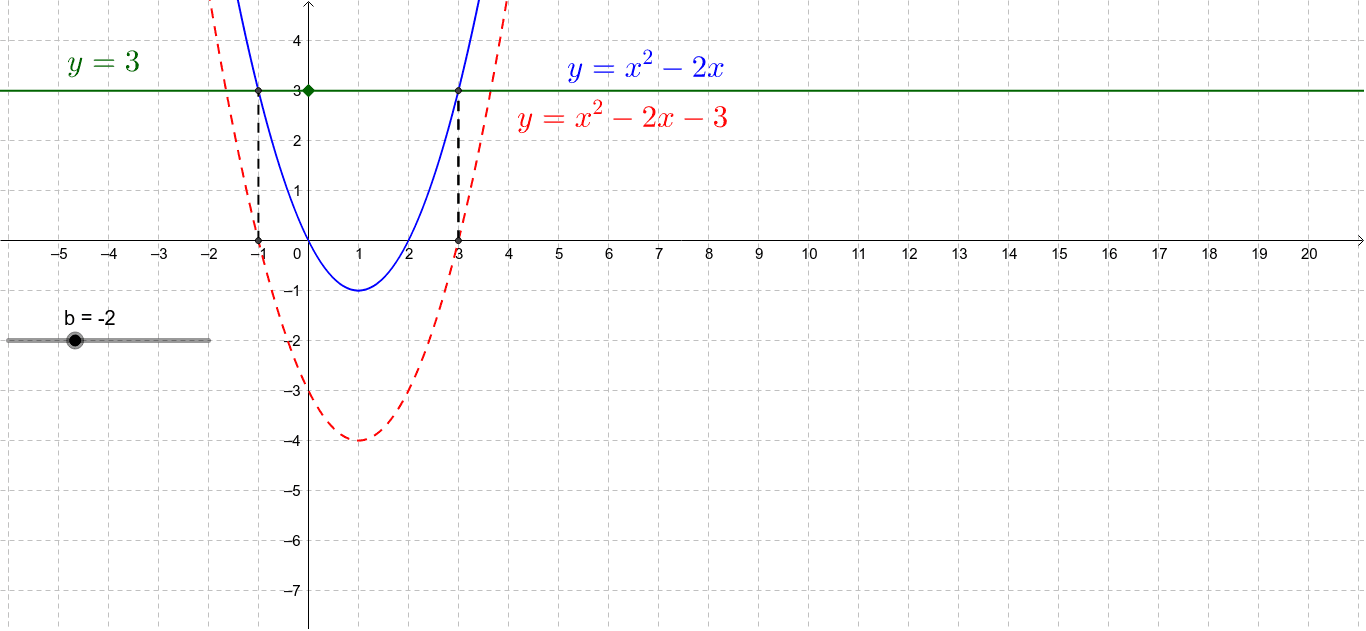
This example demonstrates the solution set of the quadratic inequality x²+bx=c. It shows how to construct the graph of the quadratic function and the region satisfying the inequality. Key mathematical concepts include quadratic functions, inequality solutions, and geometric construction. Construction involves GeoGebra commands such as Point, OrthogonalLine, Intersect, and Segment to draw points, lines, intersections, and segments. Suitable for high school students learning quadratic functions and inequalities, or for mathematical teaching demonstrations.
GeoGebra Commands & Parameters
Point(yAxis) → AOrthogonalLine(A, yAxis) → aIntersect(c, a) → B, CSegment(D, B) → eSegment(E, C) → f
AI Drawing Prompt Reference
Draw the y-axis, and from any point on it, draw a perpendicular line. This line intersects the parabola y=x²+bx at two points. The segments connecting these points to the origin represent the boundary of the solution set for the inequality x²+bx>c.
The prompt above was compiled from the original drawing commands and is for reference only.