
Quadratic Functions (Intercepts Form) Dynamic Exploration
Loading the math board and drawing, please wait…
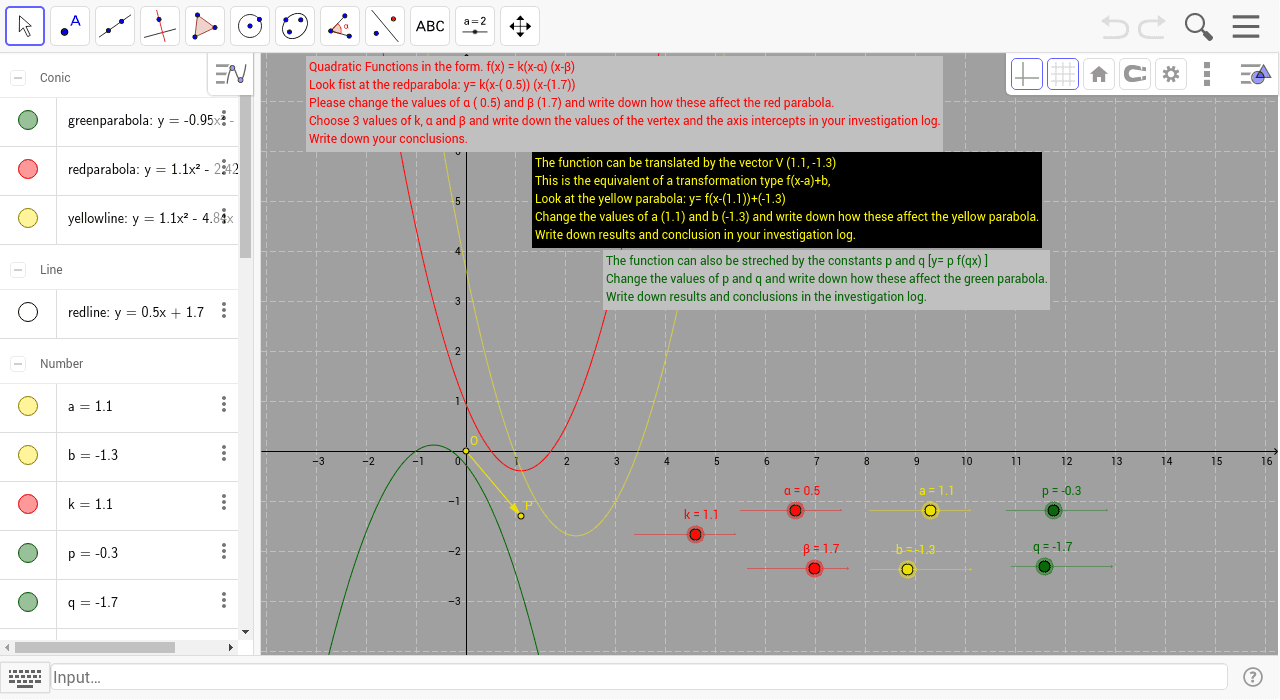
This example demonstrates the graph and properties of Quadratic Functions (Intercepts form) using a GeoGebra dynamic worksheet. Key math concepts include the intercept form of quadratic functions, vertex, axis of symmetry, and graph transformations. Construction highlights involve GeoGebra commands like Intersect, Distance, Vector, and Translate, with objects such as α, β, redline, Yintercept, distanceYinterceptxAxis, Xintercept, distanceXinterceptyAxis, a, b, P, O, u, text3, p, q, k, redparabola, yellowline, greenparabola, text2, text1. Suitable for high school mathematics education to understand the geometric meaning and parameter effects of quadratic functions.
GeoGebra Commands & Parameters
Intersect(redline, yAxis) → YinterceptDistance(Yintercept, xAxis) → distanceYinterceptxAxisIntersect(redline, xAxis) → XinterceptDistance(Xintercept, yAxis) → distanceXinterceptyAxisIntersect(xAxis, yAxis) → OVector(O, P) → uTranslate(redparabola, u) → yellowline
AI Drawing Prompt Reference
Draw a quadratic function graph showing its x and y intercepts, marking the origin. Measure the distance from the x-intercept to the y-axis and from the y-intercept to the x-axis. Translate the red parabola along the vector from the origin to the vertex to create a yellow parabola, demonstrating symmetry. Include text labels for the vertex, axis of symmetry, and transformations.
The prompt above was compiled from the original drawing commands and is for reference only.