
Quadratic Function Transformation Demo
Loading the math board and drawing, please wait…
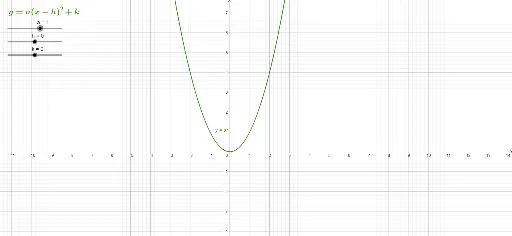
This example demonstrates the effects of translations and scalings on quadratic function graphs. It involves core concepts like quadratic function transformations, vertex coordinate changes, and the impact of parameters a and c on the graph's shape and position. The construction uses commands like Parent for the base function, sliders h and k for translations, and parameters a and c for scalings, with text elements for annotations. Suitable for high school mathematics education to visually explain function transformation rules.
GeoGebra Commands & Parameters
y = x^(2)Numeric h(0)Numeric k(0)Numeric a(1)y = (a * (x - h)^(2)) + k
AI Drawing Prompt Reference
Draw a quadratic function graph with the initial equation y=x². Add two sliders to control horizontal and vertical translations, both set to 0 initially. Then add a slider to control the coefficient of the quadratic term, set to 1 initially. Finally, translate the initial quadratic function graph horizontally by the distance of slider h, vertically by the distance of slider k, and scale it by the factor of slider a to get the final quadratic function graph y=a*(x-h)²+k.
The prompt above was compiled from the original drawing commands and is for reference only.