
Quadratic Function Graphing and Properties by Peter22
Loading the math board and drawing, please wait…
In collections
Parabolas
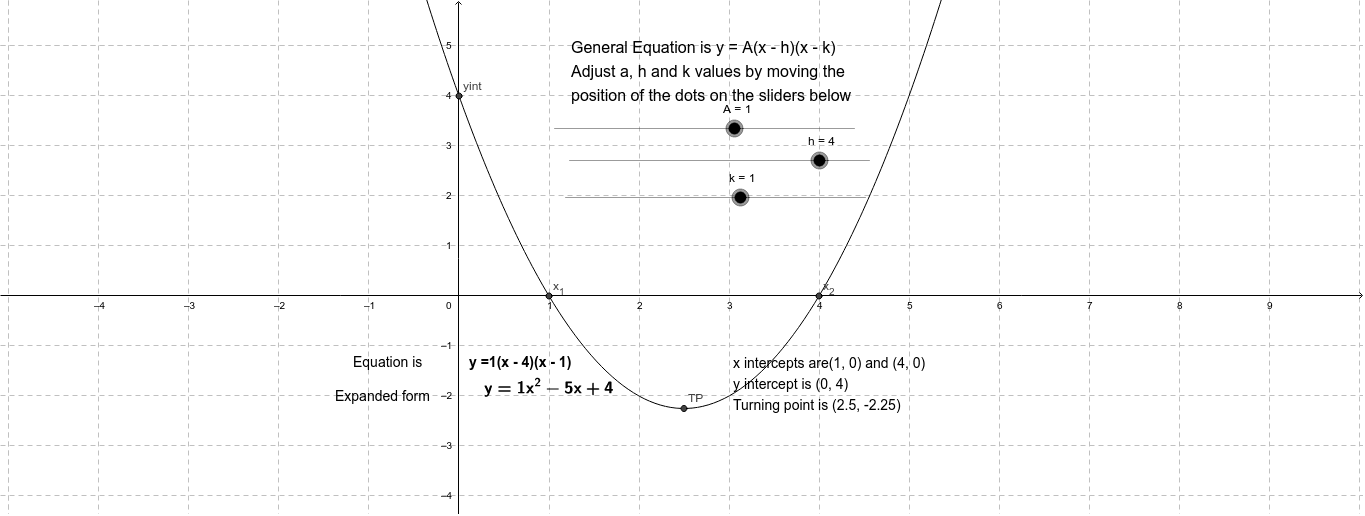
This example demonstrates how to graph quadratic functions and display their key properties including vertex, x/y-intercepts, and turning points. Core math concepts involve factorized form, vertex, and intercepts. GeoGebra commands like Root, Extremum, and Intersect are used to construct the graph and its features, with objects such as A, h, k, g, x_1, x_2, TP, yint. Suitable for high school mathematics education to understand the relationship between quadratic function properties and graphs.
GeoGebra Commands & Parameters
Root(g) → x_1, x_2Extremum(g) → TPIntersect(g, yAxis, 1) → yint
AI Drawing Prompt Reference
Draw the graph of a quadratic function, highlighting its vertex, x-intercepts, and y-intercept. First, plot the function, then identify and label the x-intercepts as x1 and x2, find the vertex and mark it as TP, and finally determine the y-intercept and label it as yint, showing the relationship between these key points and the function's graph.
The prompt above was compiled from the original drawing commands and is for reference only.