
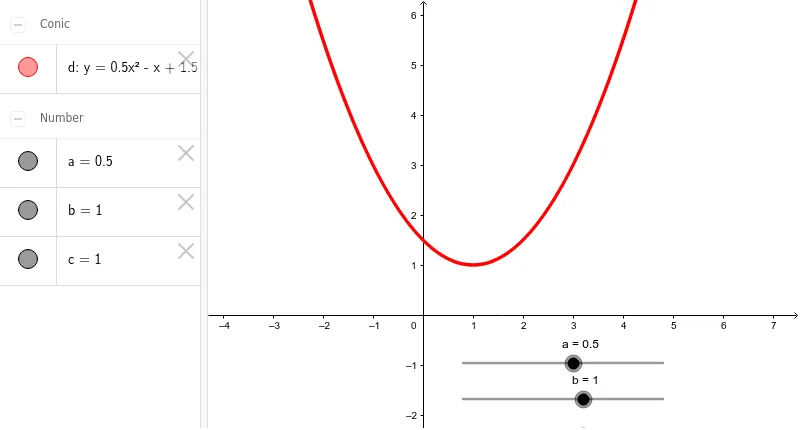
Quadratic Function Graph with Parameter Sliders
This GeoGebra example demonstrates how the graph of quadratic function y=ax²+bx+c changes as parameters a, b, and c are adjusted. Users can drag three sliders to observe in real-time how the parabola's opening direction, opening width, axis of symmetry, and intercepts change accordingly. The core mathematical concepts include quadratic functions, parabola properties, vertex coordinates, and axis of symmetry. Construction highlights: using Slider commands to create parameters a, b, c, and Function command to plot quadratic function graphs. Suitable for middle school mathematics teaching on functions, and for learning activities exploring how parameter changes affect function graphs.
Loading the math board and drawing, please wait…