
Quadratic Function Graph by STEP - המראה
Loading the math board and drawing, please wait…
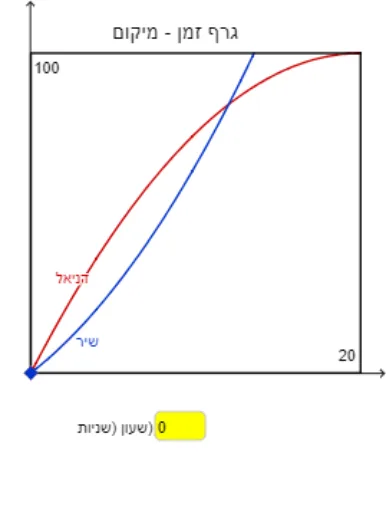
This example demonstrates the graph of a quadratic function. Key mathematical concepts include quadratic functions, vertex, and axis of symmetry. Using GeoGebra commands such as Line, Point, OrthogonalLine, and Intersect, the graph of a quadratic function can be constructed. Suitable for students in middle school and above to learn about quadratic functions.
GeoGebra Commands & Parameters
Line(C, xAxis) → iLine(D, i) → jPoint(i) → EOrthogonalLine(E, i) → kIntersect(j, k) → FTextfield(b) → InputBox1Point(i) → HOrthogonalLine(H, i) → lPoint(l) → IOrthogonalLine(I, l) → qPoint(l) → JOrthogonalLine(J, l) → rPoint(q) → LOrthogonalLine(L, q) → sIntersect(s, r) → MPolygon(I, L, M, J) → poly1, i_1, l_1, m_1, j_1Intersect(i, l_1) → NIntersect(j, l_1) → OIntersect(j_1, j) → PSegment(H, N) → t_1Segment(P, O) → cIntersect(d, i_1) → QIntersect(m_1, d) → RSegment(Q, R) → eTextfield(t) → InputBox4Textfield(a) → InputBox5Textfield(a_1) → InputBox6Textfield(text2) → InputBox2Polygon((0, 0), (0, 100), (20, 100), (20, 0)) → q1, f_1, g_1, h_1, k_1Textfield(text3) → InputBox3
AI Drawing Prompt Reference
Draw a geometric construction of a quadratic function graph. Start with a horizontal line as the x-axis)Skip, then draw a parallel line above it. Pick a point on the x-axis and draw a perpendicular line up to the parallel line, forming a rectangle. Pick another point on the x-axis, draw a perpendicular, then on that perpendicular pick a point and draw a horizontal line, creating another set of perpendicular and horizontal lines that intersect to form a rectangle. Connect relevant points with segments. Include input boxes for parameters. The overall figure shows the quadratic curve with its vertex and axis of symmetry.
The prompt above was compiled from the original drawing commands and is for reference only.