
Quadratic Function Demonstration by María Cecilia Cáceres
Loading the math board and drawing, please wait…
In collections
Quadratic Equation
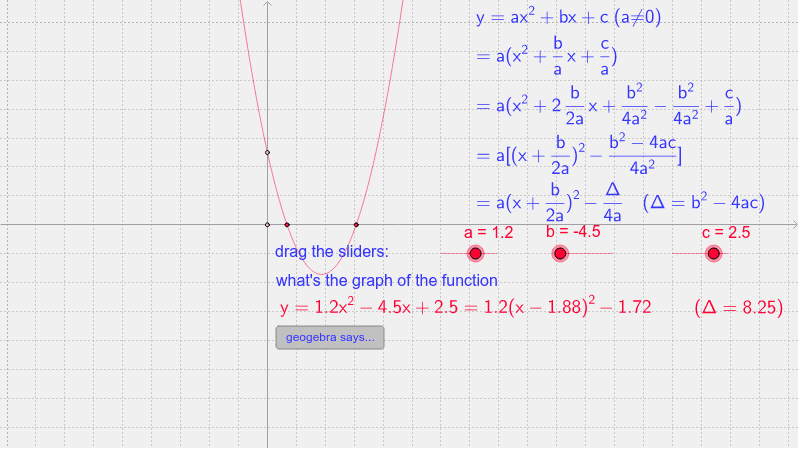
This example demonstrates the graph of the quadratic function f(x)=ax^2+bx+c and its properties, involving core math concepts like function graph, parabola, vertex, orthogonal line, intersection, segment, centroid, right triangle, orthocenter, and reflection. It uses GeoGebra commands such as Vertex, OrthogonalLine, Intersect, and Segment for construction. Suitable for high school and above students to learn about quadratic functions and their geometric properties.
GeoGebra Commands & Parameters
Vertex(c_1) → V, , ,OrthogonalLine(V, xAxis) → a_1OrthogonalLine(V, yAxis) → b_1Intersect(a_1, xAxis) → AIntersect(b_1, yAxis) → BSegment(V, B) → dIntersect(c_1, xAxis, 1) → EIntersect(c_1, xAxis, 2) → FIntersect(c_1, yAxis, 1) → G
AI Drawing Prompt Reference
Draw the graph of a quadratic function, showing its vertex, perpendicular lines to the x-axis and y-axis, the intersections of these lines with the axes, a line segment connecting the vertex to the y-axis intersection, and the two points where the function intersects the x-axis, labeling all key points and segments to illustrate the geometric properties of the quadratic function.
The prompt above was compiled from the original drawing commands and is for reference only.