
Plotting Domain and Range Using Line Segments
Loading the math board and drawing, please wait…
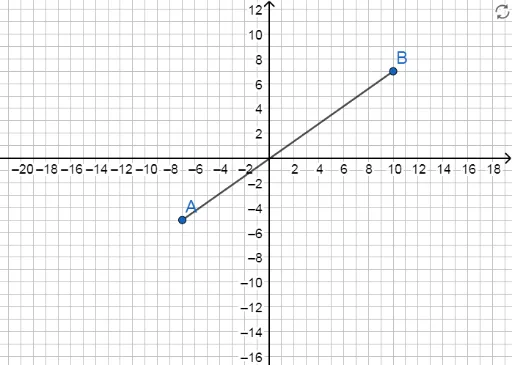
This GeoGebra example demonstrates how to visualize the domain and range of a function by drawing line segments on the coordinate plane. The core mathematical concepts involved are functions, domain, range, and interval notation on the real number line. The construction uses the Segment command to create a line segment between points A and B, while the function f is plotted to show its graph. By aligning the segment with the x-axis for the domain and with the y-axis for the range, the example clearly illustrates the set of input and output values. This is suitable for middle school, high school, or introductory calculus students learning function basics. It helps learners grasp how the domain and range relate to the graph and how changing endpoints affects the interval, making it a valuable interactive tool for classroom demonstrations or self-study.
GeoGebra Commands & Parameters
Segment(A, B) → f
AI Drawing Prompt Reference
Plot a function graph and use line segments to represent its domain and range. First, draw the function graph on the coordinate plane. Then, use a line segment to connect the starting and ending points of the domain, and another line segment to connect the starting and ending points of the range, making sure the segments are parallel to the x-axis and y-axis respectively, to clearly illustrate the input and output value ranges.
The prompt above was compiled from the original drawing commands and is for reference only.