
Quadratic Function Behavior Demo
Loading the math board and drawing, please wait…
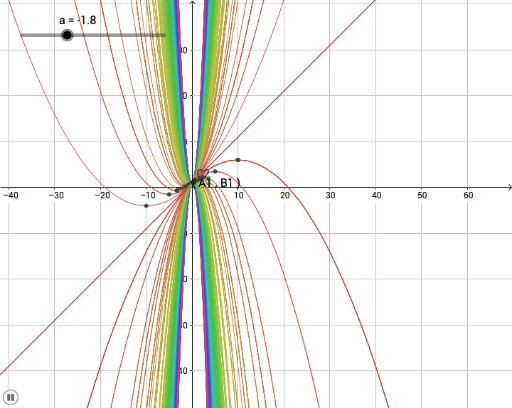
This example demonstrates the dynamic behavior of quadratic function graphs as parameters a, b, c change. Core math concepts include parabola vertex, axis of symmetry, discriminant, and function value range. GeoGebra commands like Name, slider, and locus are used to create animations and traces, visually illustrating how parameters affect the function's shape. Suitable for high school mathematics instruction to intuitively understand quadratic function properties and parameter significance.
GeoGebra Commands & Parameters
Name(C1) → D1Name(C2) →Name(C2) →Name(C2) →Name(C2) →