
Quadratic Formula and Graph
Loading the math board and drawing, please wait…
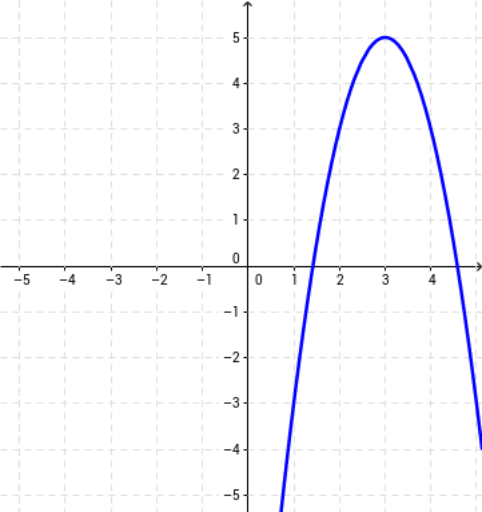
This example demonstrates the relationship between quadratic functions and their graphs, highlighting key concepts like quadratic formula, function graphing, discriminant, and vertex coordinates. It utilizes GeoGebra commands such as RandomElement, KeepIf, Intersect, and Circle. Suitable for high school mathematics education to understand quadratic function properties and formula applications.
GeoGebra Commands & Parameters
RandomElement(KeepIf[(x ≠ 0) ∧ (x ≥ Max[xmin, ymin]) ∧ (x ≤ Min[xmax, ymax]), Sequence[i, i, (-abs((xmin * ymin))), abs((xmax * ymax)) + If[rs, 0, 0]]]) → numbersectionexamKeepIf(x ≠ 0, Sequence[i, i, -3, 3 + If[rs, 0, 0]]) → list4aRandomElement(KeepIf[x ≠ 0, Sequence[i, i, -5, 5 + If[rs, 0, 0]]]) → numverSelectionwithExcludingKeepIf(x ≠ 0, Sequence[i, i, -3, 3 + If[rs, 0, 0]]) → list4bRandomElement(list4a) → ranaRandomElement(list4b) → ranbTool2(rana, ranc, ((2 * rana) * ranb)) → text1Intersect(f, xAxis) → A, BMirror(f, g) → f_1Intersect(xAxis, f_1) → C, DCircle(M, C) → cOrthogonalLine(M, xAxis) → hIntersect(c, h) → E, F
AI Drawing Prompt Reference
Draw the graph of a quadratic function, showing the connection to the quadratic formula. Randomly generate coefficients for the quadratic function and plot its graph on the coordinate system. Mark the intersection points with the x-axis, draw a circle through these points, find the intersections of the circle with the function graph, and finally draw a perpendicular line through the vertex, labeling key points.
The prompt above was compiled from the original drawing commands and is for reference only.