
Quadratic Equation and Parabola: How Coefficients Affect Intersections
Loading the math board and drawing, please wait…
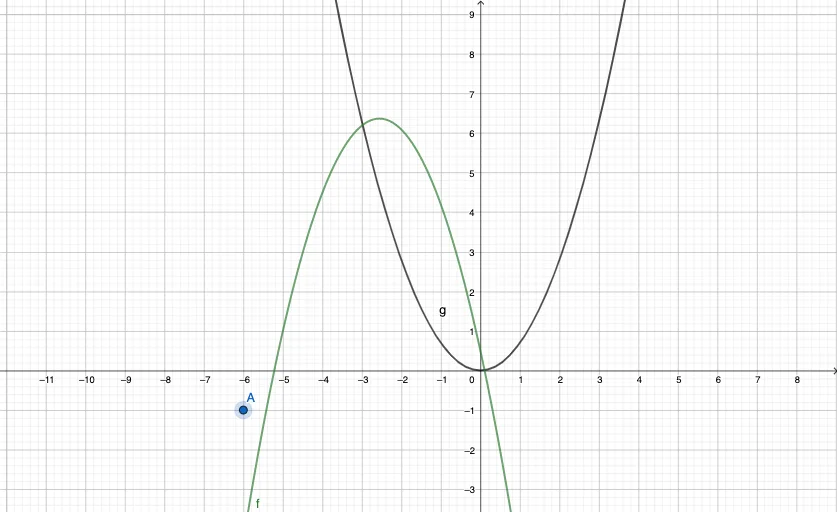
① This example dynamically adjusts the coefficients a, b, c of the quadratic function y = ax² + bx + c to visually demonstrate how the parabola's shape and its intersections with the x-axis (i.e., real roots of the quadratic equation) change. ② Core mathematical concepts include quadratic functions, quadratic equations, discriminant, parabola opening direction, vertex position, and intersections with coordinate axes. ③ Construction highlights: from the summary, sliders a, b, c control coefficients, function f represents the parabola, point A and line m may mark intersections or the axis of symmetry, and object g may serve as an auxiliary line or tangent; the GeoGebra dynamic interaction enables real-time graph updates under parameter changes. ④ Suitable for middle and high school students learning quadratic functions and equations, as well as for classroom demonstrations or self-exploration of how coefficients affect the graph.
GeoGebra Commands & Parameters
Numeric a(-0.9)Numeric b(-4.6)Numeric c(0.5)f(x) = (a * x^(2)) + (b * x) + cPoint A(-6, -1)Numeric m(0.7)y = (m * x^(2))
AI Drawing Prompt Reference
Draw a Cartesian coordinate plane with a parabola defined by a quadratic function whose coefficients are controlled by three sliders. Adjusting these sliders changes the parabola's opening direction, width, and vertical position in real time. Mark the intersections of the parabola with the x-axis to show how the real roots of the quadratic equation vary. Additionally, include a second auxiliary parabola controlled by another parameter for comparison of different quadratic shapes. The graph should clearly illustrate how coefficient changes affect the parabola's form and its intercepts.
The prompt above was compiled from the original drawing commands and is for reference only.