
Pythagorean Theorem Visualization by Terry Lee Lindenmuth
Loading the math board and drawing, please wait…
In collections
Geo&Alg:Area Volume Pythagorean Th.
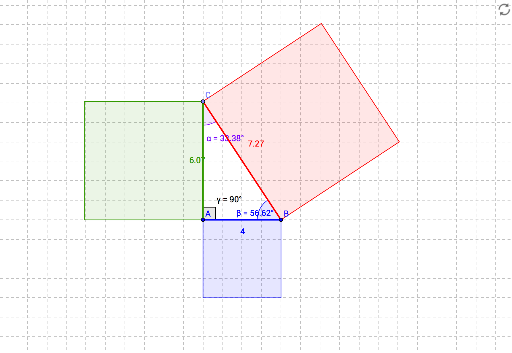
This example demonstrates the Pythagorean Theorem, which states that in a right-angled triangle, the square of the hypotenuse is equal to the sum of the squares of the other two sides. It involves key mathematical concepts such as right triangles, Pythagorean theorem, and distance calculation. Using GeoGebra commands like Segment, OrthogonalLine, Point, etc., a dynamic right triangle is constructed to visually prove the theorem. Suitable for middle school and above students for learning and teachers for teaching.
GeoGebra Commands & Parameters
Segment(A, B) → aOrthogonalLine(A, a) → bPoint(b) → CSegment(C, B) → cSegment(C, A) → dPolygon(C, B, 4) → poly1, e, f, g, h, D, EPolygon(B, A, 4) → poly2, i, j, k, l, F, GPolygon(A, C, 4) → poly3, m, n, p, q, H, IAngle(A, C, B) → αAngle(C, B, A) → βAngle(B, A, C) → γDistance(a, c) → o
AI Drawing Prompt Reference
Draw a right triangle ABC with A as the right angle. First, draw segment AB. Then, construct a perpendicular line to AB through point A, and let it intersect at point C. Next, draw segments BC and AC to form the right triangle. Finally, calculate the length of the hypotenuse BC.
The prompt above was compiled from the original drawing commands and is for reference only.