
Proving the Pythagorean Theorem with 3D Geometric Visualization (Geo.3.14)
Loading the math board and drawing, please wait…
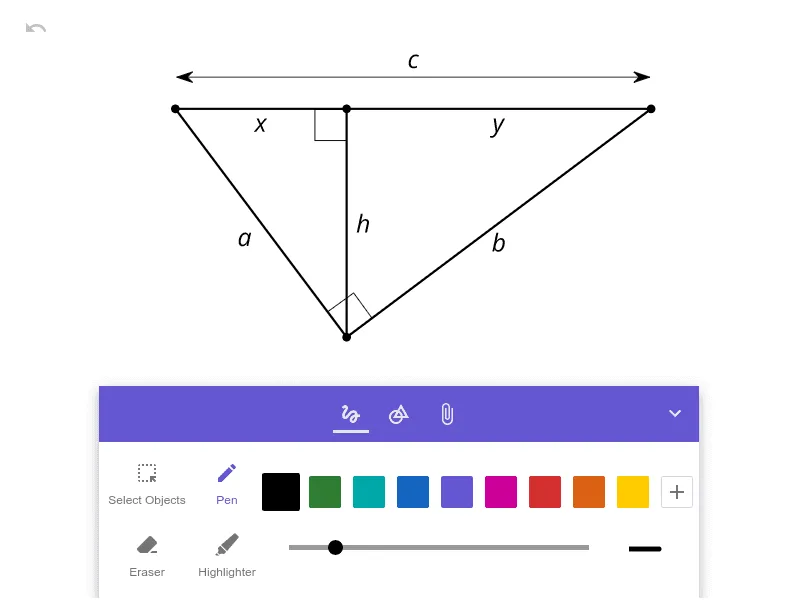
This GeoGebra example uses a 3D/solid-geometry style visualization of a right triangle and its related geometric constructions to support understanding and proof of the Pythagorean Theorem. Key ideas include right triangles, the statement a^2+b^2=c^2, interpreting side lengths through geometric quantities, and connecting those quantities to algebraic relationships. The construction is organized around the main visualization object (pic1) and employs three-dimensional geometric representation consistent with the lesson theme—highlighting vector-based 3D components and cuboid/solid configurations to make the area/length relationship intuitive. It is suitable for middle to high school math classes, especially for introductory proof activities, geometry review, and classroom demonstrations that bridge spatial reasoning with algebra.
AI Drawing Prompt Reference
Create a 3D solid-geometry visualization illustrating the Pythagorean theorem. Center a right triangle, with each side serving as the edge of a distinct cuboid or square prism. Color-code the three solids differently, and label their side lengths to show the relationship a² + b² = c². Use translucent surfaces or guide lines to emphasize the spatial connection between the triangle and the solids, making the area-to-length relationship intuitive. The composition should highlight the three-dimensional arrangement and support a clear geometric proof.
The prompt above was compiled from the original drawing commands and is for reference only.