
Property of Square Root Graphs: Transformations and Visualization
Loading the math board and drawing, please wait…
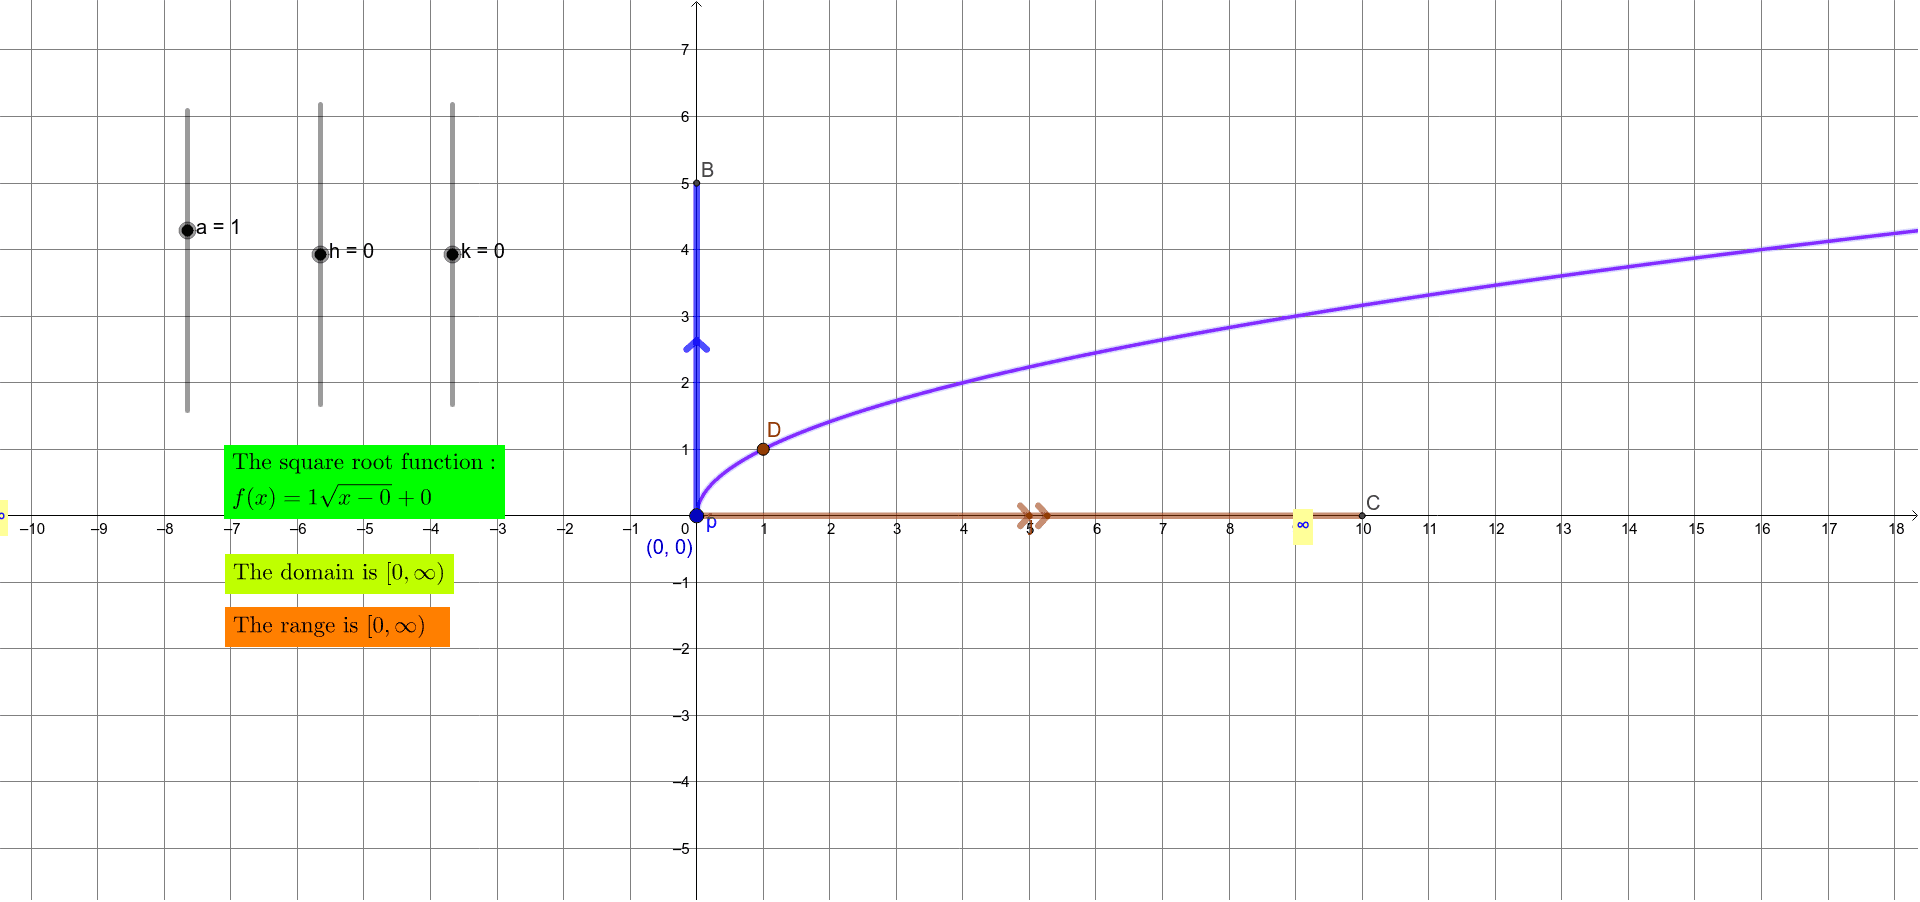
This GeoGebra example investigates the properties and transformations of square root functions, focusing on how parameters affect the graph's position and shape. Core mathematical concepts include the square root function, domain and range, and horizontal and vertical translations ($y = a\sqrt{x-h} + k$). The construction utilizes the Segment command to create sliders for parameters $a, h, and k$, with text objects (text1 to text8) dynamically displaying the algebraic expressions. Multiple function objects ($f, g, i, j, p$) are plotted to visualize how the curves shift, providing a clear geometric interpretation of coordinate transformations. This resource is highly suitable for high school algebra and precalculus courses, aiding teachers in demonstrating function graphing dynamically.
GeoGebra Commands & Parameters
Segment(B, A) → gSegment(A, B) → iSegment(A, C) → j