
Probability Template: Interactive Distributions and Tree Diagrams for Studix
Loading the math board and drawing, please wait…
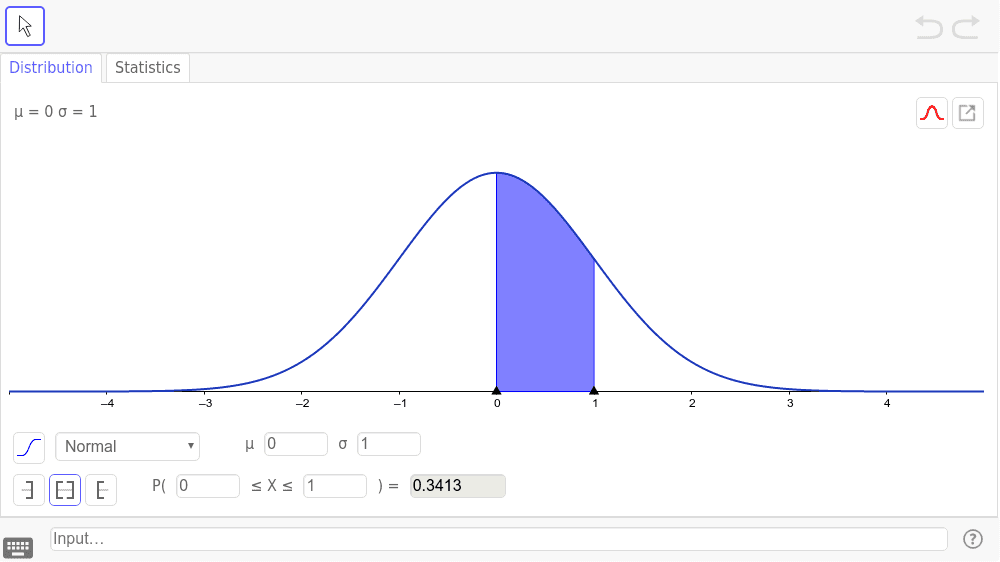
① This example provides a reusable probability template designed for the Studix system, demonstrating probability calculations, distribution graphs, and tree diagrams in an interactive environment. ② Core mathematical concepts include probability distributions, conditional probability, event combinations, tree diagram analysis, and the multiplication and addition rules of probability, along with function graphs to visualize density or cumulative distribution functions. ③ Construction highlights: although no specific GeoGebra commands are listed in the summary, the theme tags suggest the use of function graphs to plot distributions, sliders or input fields to adjust parameters, tree diagrams to show branch probabilities, and possibly built-in distribution commands or custom functions, with division operations for computing probability ratios. ④ Suitable for high school to undergraduate probability and statistics courses, this template serves as an interactive teaching tool for instructors or a self-exploration resource for students, facilitating understanding of random events, independence, and conditional probability, and can be embedded within the Studix learning management system.