
Probability Simulation: Marble Drawing and Frequency Distribution
Loading the math board and drawing, please wait…
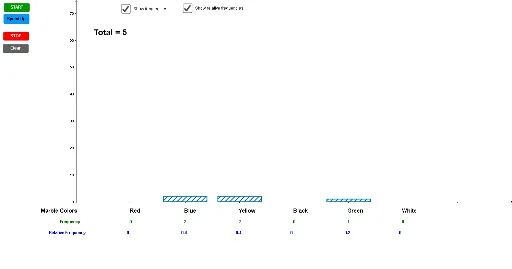
This GeoGebra example dynamically simulates random draws from a set of multicolored marbles, visually demonstrating the relationship between empirical frequency and theoretical probability. Core mathematical concepts include probability and statistics, random events, frequency distributions, ratios, and arithmetic operations such as subtraction. Construction highlights: uses RandomDiscrete and Random commands to generate random outcomes, Frequency and Unique to count occurrences of each color, BarChart to plot frequency bars, TableText to display data tables, and buttons (button2, RESET, STOP) plus a speed slider to control simulation pace and reset. Key objects include Marbles, color variables Red1 through Green6, and lists like dlist, NumTwos, NumOnes. Suitable for middle and high school probability lessons, this tool helps students grasp the law of large numbers and how relative frequency stabilizes around probability, while exploring the impact of sample size on randomness.
GeoGebra Commands & Parameters
Frequency({2, 2}, dlist) → TwosElement(Twos, 1) → NumTwosFrequency({1, 1}, dlist) → OnesElement(Ones, 1) → NumOnesUnique(dlist) → list1Frequency(dlist) → dfreqIf(dlist ≟ {}, 0.1, Sum[dfreq]) → sumRandom(0, Marbles - 1) → Red1Random(0, Marbles - Red1) → Blue2Random(0, Marbles - Blue2 - Red1) → Yellow3Random(0, Marbles - Yellow3 - Blue2 - Red1) → Black4Random(0, Marbles - Black4 - Yellow3 - Blue2 - Red1) → White5BarChart(dlist, 0.8) → bAppend(row1, "TOTAL") → row1aAppend(row2, sum) → row2aTableText({row1a, row2a}, "c_") → text2Random(0, Marbles - 1) → aRandom(0, Marbles - 1) → cRandom(0, Marbles - 1) → dRandom(0, Marbles - 1) → eRandom(0, Marbles - 1) → fRandom(0, Marbles - 1) → gRandom(0, Marbles - 1) → hRandom(0, Marbles - 1) → iRandom(0, Marbles - 1) → jRandom(0, Marbles - 1) → kTableText({row0, row1, row2, row3, row4, row5, row6}, "c_") → AnswersRandomDiscrete({1, 2, 3, 4, 5, 6}, {1 / 6, 1 / 6, 1 / 6, 1 / 6, 1 / 6, 1 / 6}) → Outcome1Frequency({3, 3}, dlist) → ThreesFrequency({4, 4}, dlist) → FoursFrequency({5, 5}, dlist) → FivesFrequency({6, 6}, dlist) → SixesElement(Threes, 1) → NumThreesElement(Fours, 1) → NumFoursElement(Fives, 1) → NumFivesElement(Sixes, 1) → NumSixesText(NumOnes) → text13Text(NumTwos) → text14Text(NumThrees) → text15Text(NumFours) → text16Text(NumFives) → text17Text(NumSixes) → text18Text(FreqOne) → text19Text(FreqTwo) → text20Text(FreqThree) → text21Text(FreqFour) → text22Text(FreqFive) → text23Text(FreqSix) → text24Text(("Total = " * sum)) → text27