
Probability: Selecting Balls by Virginia Keith
Loading the math board and drawing, please wait…
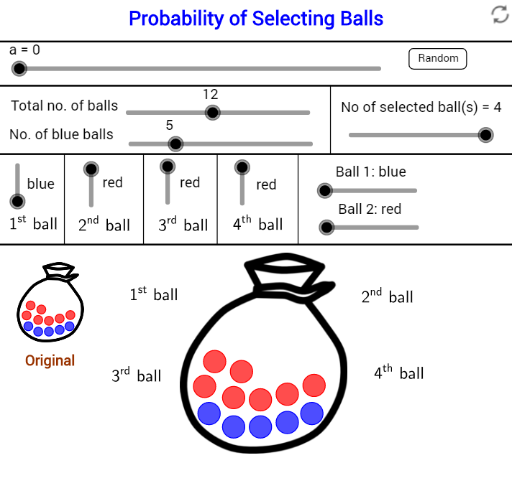
This example demonstrates probability calculations and visualization when randomly selecting balls from different colored sets. Core math concepts include probability, addition principles, definite integrals, and statistics. GeoGebra commands used are Sequence, Shuffle, If, Point, and Segment for constructing the model. Suitable for high school students learning probability & statistics and discrete mathematics, ideal for classroom demonstrations and interactive explorations.
GeoGebra Commands & Parameters
Sequence(Circle[Element[Centre00, i], BallRadius], i, 2, NoB + 1) → BallBlueList01Sequence(Circle[Element[Centre00, i], BallRadius], i, NoB + 2, nb + 1) → BallRedList01Sequence(i, i, 2, NoB + 1) → BlueListSequence(i, i, NoB + 2, nb + 1) → RedListShuffle(BlueList) → BlueRandomListShuffle(RedList) → RedRandomListSequence(If[Element[SelectedColourNoList, i] ≟ 1, Element[BlueRandomList, i], Element[RedRandomList, i]], i, 1, NoS) → SelectNoListSequence(Circle[Element[Centre001, i], BallRadiusSmall], i, 2, NoB + 1) → BallBlueList001Sequence(Circle[Element[Centre001, i], BallRadiusSmall], i, NoB + 2, nb + 1) → BallRedList001Sequence(Element[Centre00, Element[SelectNoList, i]], i, 1, NoS) → MoveStartIf(a < 5, Element[MoveStart, 1], If[a > 15, C01, (FindCor(a, 5, 15, x(Element[MoveStart, 1]), x(C01)), FindCor(a, 5, 15, y(Element[MoveStart, 1]), y(C01)))]) → C01MoveIf(a < 25, Element[MoveStart, 2], If[a > 35, C02, (FindCor(a, 25, 35, x(Element[MoveStart, 2]), x(C02)), FindCor(a, 25, 35, y(Element[MoveStart, 2]), y(C02)))]) → C02MoveIf(a < 45, Element[MoveStart, 3], If[a > 55, C03, (FindCor(a, 45, 55, x(Element[MoveStart, 3]), x(C03)), FindCor(a, 45, 55, y(Element[MoveStart, 3]), y(C03)))]) → C03MoveIf(a < 65, Element[MoveStart, 4], If[a > 75, C04, (FindCor(a, 65, 75, x(Element[MoveStart, 4]), x(C04)), FindCor(a, 65, 75, y(Element[MoveStart, 4]), y(C04)))]) → C04MoveSequence(If[Element[SelectedColourNoList, i] ≟ 1, Circle[Element[MoveCentre, i], BallRadius]], i, 1, NoS) → BallBlueSelectedListSequence(If[Element[SelectedColourNoList, i] ≟ 2, Circle[Element[MoveCentre, i], BallRadius]], i, 1, NoS) → BallRedSelectedListSequence(Circle[Element[MoveStart, i], (Lfactor * BallRadius)], i, 1, NoS) → WhiteCircleListIf(Ball01 ≟ 1, NoOfBlue00 - 1, NoOfBlue00) → NoOfBlue01If(Ball02 ≟ 1, NoOfBlue01 - 1, NoOfBlue01) → NoOfBlue02If(Ball03 ≟ 1, NoOfBlue02 - 1, NoOfBlue02) → NoOfBlue03If(Ball04 ≟ 1, NoOfBlue03 - 1, NoOfBlue03) → NoOfBlue04If(Ball01 ≟ 2, NoOfRed00 - 1, NoOfRed00) → NoOfRed01If(Ball02 ≟ 2, NoOfRed01 - 1, NoOfRed01) → NoOfRed02If(Ball03 ≟ 2, NoOfRed02 - 1, NoOfRed02) → NoOfRed03If(Ball04 ≟ 2, NoOfRed03 - 1, NoOfRed03) → NoOfRed04Sequence(If[Element[SelectedColourNoList, i] ≟ 1, Element[NoOfBlue, i], Element[NoOfRed, i]], i, 1, NoS + 1) → NoOfBallNumeratorPoint(d) → Z06Point(c) → Z05Segment(Z05, Y05) → mSegment(Z06, Y06) → kPoint(d) → Z07Point(d) → Z08Point(d) → Z09Segment(Z07, Y07) → nSegment(Z08, Y08) → pSegment(Z09, Y09) → q
AI Drawing Prompt Reference
Create a probability teaching diagram showing the process of randomly selecting balls from blue and red sets. Draw two groups of balls of different colors using circles of varying sizes. Shuffle the balls in each group randomly, then move the selected balls to designated positions based on the chosen color. Represent the selected balls with smaller circles and connect them with lines. Finally, display the number of remaining balls and use lines and points to draw statistical charts showing probability and statistics.
The prompt above was compiled from the original drawing commands and is for reference only.