
Probability Distributions Demo by Adam Knowles
Loading the math board and drawing, please wait…
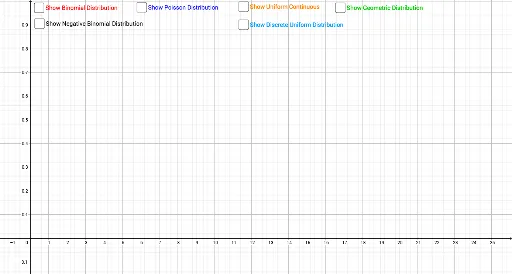
This example demonstrates the graphical representation and calculation of binomial, Poisson, and uniform distributions. It involves core math concepts like probability statistics, distribution functions, mean and variance, and statistical charts. Constructed using GeoGebra commands BinomialDist, Poisson, Uniform, BarChart, If, with objects like n, p, Binom, g, m, Poisson, d, a, b, f, c, A1-A26, B1-B2. Suitable for high school students and teachers for probability statistics teaching and visualization exploration.
GeoGebra Commands & Parameters
BinomialDist(n, p) → BinomPoisson(m) → PoissonUniform(a, b, x) → fBarChart(ZPlus, Geo) → GeometricBarChart(ZPlus, NB) → NegBinBarChart(ZPlus, DU) → DiscreteUniformIf(A2 ≤ 1, k, 0) → iIf(A2 ≤ n, k, 0) → D2If(A3 ≤ n, k, 0) → D3If(A4 ≤ n, k, 0) → D4If(A5 ≤ n, k, 0) → D5If(A6 ≤ n, k, 0) → D6If(A7 ≤ n, k, 0) → D7If(A8 ≤ n, k, 0) → D8If(A9 ≤ n, k, 0) → D9If(A10 ≤ n, k, 0) → D10If(A11 ≤ n, k, 0) → D11If(A12 ≤ n, k, 0) → D12If(A13 ≤ n, k, 0) → D13If(A14 ≤ n, k, 0) → D14If(A15 ≤ n, k, 0) → D15If(A16 ≤ n, k, 0) → D16If(A17 ≤ n, k, 0) → D17If(A18 ≤ n, k, 0) → D18If(A19 ≤ n, k, 0) → D19If(A20 ≤ n, k, 0) → D20If(A21 ≤ n, k, 0) → D21If(A22 ≤ n, k, 0) → D22If(A23 ≤ n, k, 0) → D23If(A24 ≤ n, k, 0) → D24If(A25 ≤ n, k, 0) → D25If(A26 ≤ n, k, 0) → D26
AI Drawing Prompt Reference
Create a probability distribution demonstration graph including binomial, Poisson, and uniform distributions. Use n and p to plot the binomial distribution, m for the Poisson distribution, and a and b for the uniform distribution. Then, plot the corresponding bar charts to show the probability density of each distribution.
The prompt above was compiled from the original drawing commands and is for reference only.