
Prime Number Sieve Patterns 2: Visualizing Large-Number Sieve Process
Loading the math board and drawing, please wait…
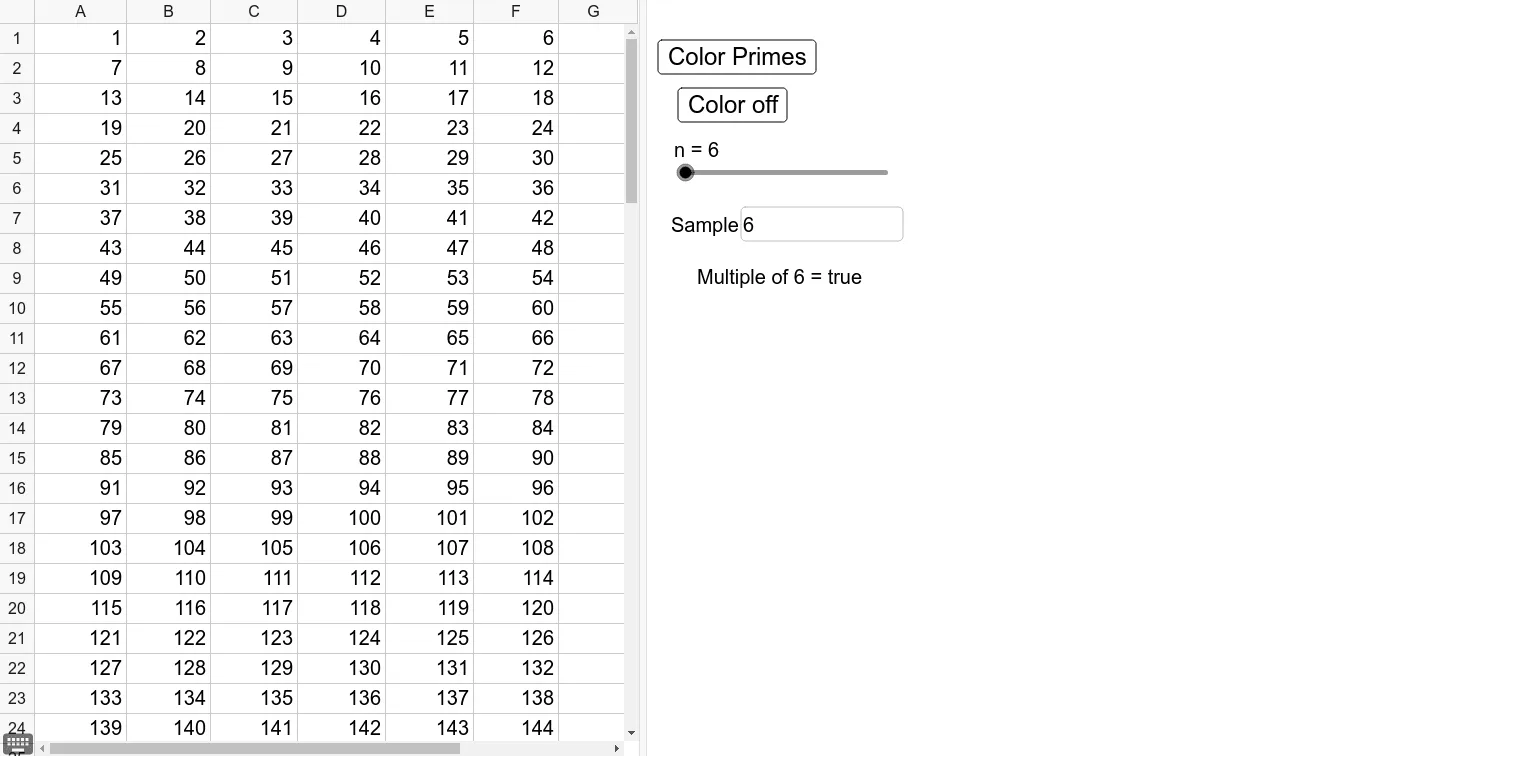
This GeoGebra example demonstrates the Sieve of Eratosthenes for large numbers, visualizing how prime numbers are distributed among natural numbers through an interactive grid. The core mathematical concepts include prime numbers, divisibility, the sieve algorithm, and prime distribution patterns. Construction highlights: the use of RemoveUndefined to clean undefined cells, Textfield for dynamic input of the upper bound, If conditions to mark composite numbers, and a multi-row/column object layout (e.g., A1 to G7) to display the sieve steps. Suitable for high school to early university students learning number theory, this example helps explore prime density, understand algorithmic thinking, and can serve as a visual aid for math experiments or introductory programming lessons.
GeoGebra Commands & Parameters
RemoveUndefined(Flatten[Sequence[Sequence[If[IsPrime[Cell[X, Y]], UnicodeToLetter[X + 64] + (Y)], Y, 1, Length[A1:A99]], X, 1, Length[A1:Z1]]]) → PrimesListTextfield(cols) → InputColsTextfield(rows) → InputRowsTextfield(n) → InputStartIf(Mod[n, 6] ≟ 0, true, false) → test0
AI Drawing Prompt Reference
Create an interactive grid visualization for the Sieve of Eratosthenes over large numbers. The grid consists of multiple rows and columns, with each cell representing a natural number. Prime numbers are highlighted distinctly, while composite numbers are marked or dimmed. At the top, include three input fields to adjust the number of columns, rows, and the starting value. The grid should automatically clean up undefined cells for clarity. The overall layout should illustrate the step-by-step sieving process, suitable for educational purposes in number theory or programming.
The prompt above was compiled from the original drawing commands and is for reference only.