
Preloaded Data for Statistics Example
Loading the math board and drawing, please wait…
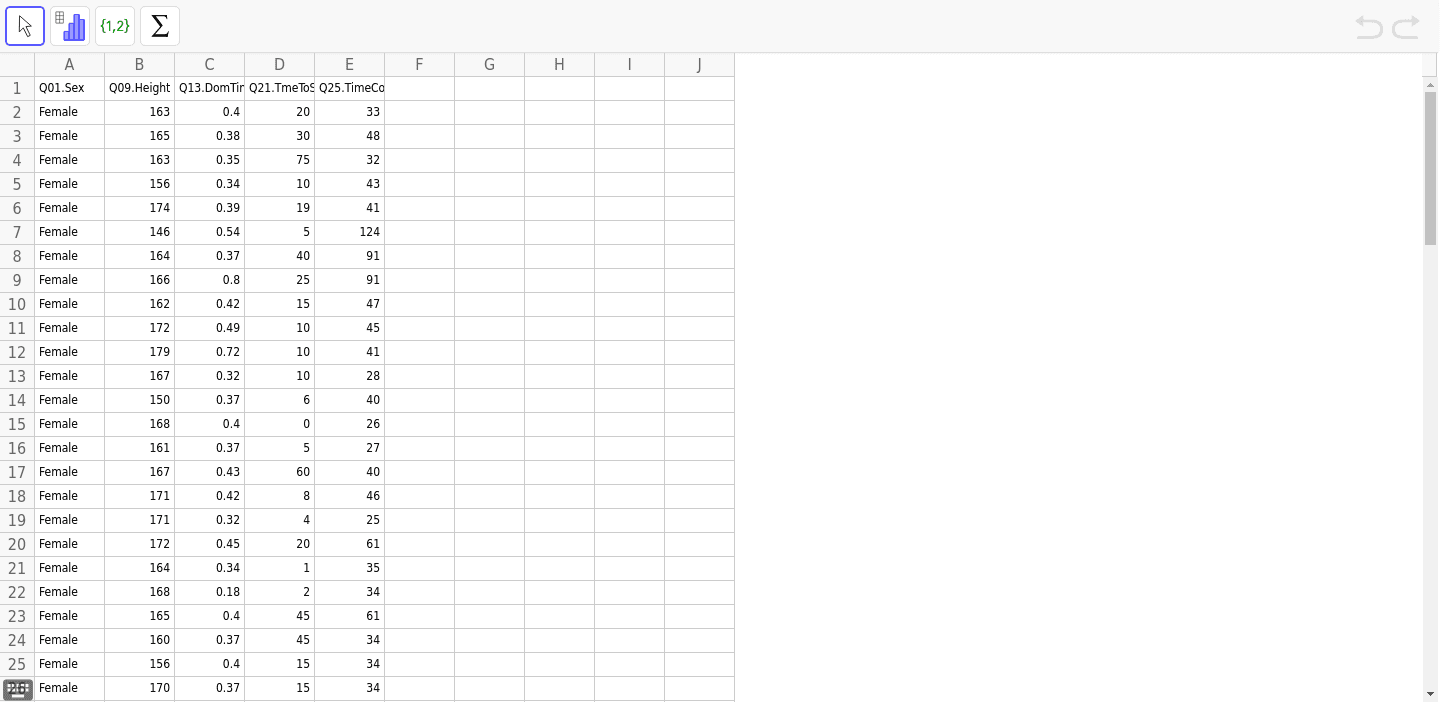
This example demonstrates how to create a histogram using spreadsheet data for statistical analysis. Core math concepts include data statistics, histogram plotting, and probability & statistics. It uses GeoGebra commands Classes and Histogram, with objects A1 to E8 representing data cells. Suitable for high school mathematics lessons on data analysis and statistical graphing.
GeoGebra Commands & Parameters
Classes({C2, C3, C4, C5, C6, C7, C8, C9, C10, C11, C12, C13, C14, C15, C16, C17, C18, C19, C20, C21, C22, C23, C24, C25, C26, C27, C28, C29, C30, C31, C32, C33, C34, C35, C36, C37, C38, C39, C40, C41, C42, C43, C44, C45, C46, C47, C48, C49, C50, C51, C52, C53, C54, C55, C56, C57, C58, C59, C60, C61, C62, C63, C64, C65, C66, C67, C68, C69, C70, C71, C72, C73, C74, C75, C76, C77, C78, C79, C80, C81, C82, C83, C84, C85, C86, C87, C88, C89, C90, C91, C92, C93, C94, C95, C96, C97, C98, C99, C100, C101}, 20) →Histogram(false, Classes[{C2, C3, C4, C5, C6, C7, C8, C9, C10, C11, C12, C13, C14, C15, C16, C17, C18, C19, C20, C21, C22, C23, C24, C25, C26, C27, C28, C29, C30, C31, C32, C33, C34, C35, C36, C37, C38, C39, C40, C41, C42, C43, C44, C45, C46, C47, C48, C49, C50, C51, C52, C53, C54, C55, C56, C57, C58, C59, C60, C61, C62, C63, C64, C65, C66, C67, C68, C69, C70, C71, C72, C73, C74, C75, C76, C77, C78, C79, C80, C81, C82, C83, C84, C85, C86, C87, C88, C89, C90, C91, C92, C93, C94, C95, C96, C97, C98, C99, C100, C101}, 20], {C2, C3, C4, C5, C6, C7, C8, C9, C10, C11, C12, C13, C14, C15, C16, C17, C18, C19, C20, C21, C22, C23, C24, C25, C26, C27, C28, C29, C30, C31, C32, C33, C34, C35, C36, C37, C38, C39, C40, C41, C42, C43, C44, C45, C46, C47, C48, C49, C50, C51, C52, C53, C54, C55, C56, C57, C58, C59, C60, C61, C62, C63, C64, C65, C66, C67, C68, C69, C70, C71, C72, C73, C74, C75, C76, C77, C78, C79, C80, C81, C82, C83, C84, C85, C86, C87, C88, C89, C90, C91, C92, C93, C94, C95, C96, C97, C98, C99, C100, C101}, true, -1) → aClasses({C2, C3, C4, C5, C6, C7, C8, C9, C10, C11, C12, C13, C14, C15, C16, C17, C18, C19, C20, C21, C22, C23, C24, C25, C26, C27, C28, C29, C30, C31, C32, C33, C34, C35, C36, C37, C38, C39, C40, C41, C42, C43, C44, C45, C46, C47, C48, C49, C50, C51, C52, C53, C54, C55, C56, C57, C58, C59, C60, C61, C62, C63, C64, C65, C66, C67, C68, C69, C70, C71, C72, C73, C74, C75, C76, C77, C78, C79, C80, C81, C82, C83, C84, C85, C86, C87, C88, C89, C90, C91, C92, C93, C94, C95, C96, C97, C98, C99, C100, C101}, 20) →Histogram(false, Classes[{C2, C3, C4, C5, C6, C7, C8, C9, C10, C11, C12, C13, C14, C15, C16, C17, C18, C19, C20, C21, C22, C23, C24, C25, C26, C27, C28, C29, C30, C31, C32, C33, C34, C35, C36, C37, C38, C39, C40, C41, C42, C43, C44, C45, C46, C47, C48, C49, C50, C51, C52, C53, C54, C55, C56, C57, C58, C59, C60, C61, C62, C63, C64, C65, C66, C67, C68, C69, C70, C71, C72, C73, C74, C75, C76, C77, C78, C79, C80, C81, C82, C83, C84, C85, C86, C87, C88, C89, C90, C91, C92, C93, C94, C95, C96, C97, C98, C99, C100, C101}, 20], {C2, C3, C4, C5, C6, C7, C8, C9, C10, C11, C12, C13, C14, C15, C16, C17, C18, C19, C20, C21, C22, C23, C24, C25, C26, C27, C28, C29, C30, C31, C32, C33, C34, C35, C36, C37, C38, C39, C40, C41, C42, C43, C44, C45, C46, C47, C48, C49, C50, C51, C52, C53, C54, C55, C56, C57, C58, C59, C60, C61, C62, C63, C64, C65, C66, C67, C68, C69, C70, C71, C72, C73, C74, C75, C76, C77, C78, C79, C80, C81, C82, C83, C84, C85, C86, C87, C88, C89, C90, C91, C92, C93, C94, C95, C96, C97, C98, C99, C100, C101}, true, -1) → b
AI Drawing Prompt Reference
Create a histogram using data from a table to show the statistical distribution. The table contains multiple columns of data, each representing a data category. First, generate data classes and frequency distribution based on this data, then draw the histogram where each bar corresponds to a data category and its height represents the frequency. The histogram should clearly display the data distribution, suitable for statistical analysis lessons.
The prompt above was compiled from the original drawing commands and is for reference only.