
Predator-Prey Population Using Sine
Loading the math board and drawing, please wait…
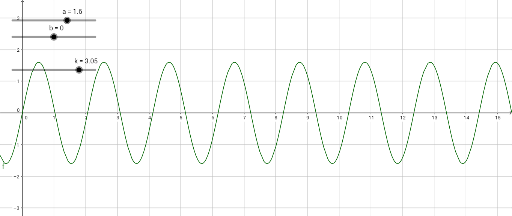
This example demonstrates the graphical representation of predator-prey population dynamics modeled using sine functions. Key math concepts include trigonometry, exponential functions, and algebra. Construction involves GeoGebra objects: parameters a, b, k, and function f. Suitable for high school biology mathematics and introductory calculus students to understand periodic population fluctuations.
GeoGebra Commands & Parameters
Numeric a(1.6)Numeric b(0)Numeric k(3.05)f(x) = (a * sin((k * x))) + b